Nokia 2014 Annual Report Download - page 149
Download and view the complete annual report
Please find page 149 of the 2014 Nokia annual report below. You can navigate through the pages in the report by either clicking on the pages listed below, or by using the keyword search tool below to find specific information within the annual report.-
 1
1 -
2
-
3
-
4
-
5
-
6
-
7
-
8
-
9
-
10
-
11
-
12
-
13
-
14
-
15
-
16
-
17
-
18
-
19
-
20
-
21
-
22
-
23
-
24
-
25
-
26
-
27
-
28
-
29
-
30
-
31
-
32
-
33
-
34
-
35
-
36
-
37
-
38
-
39
-
40
-
41
-
42
-
43
-
44
-
45
-
46
-
47
-
48
-
49
-
50
-
51
-
52
-
53
-
54
-
55
-
56
-
57
-
58
-
59
-
60
-
61
-
62
-
63
-
64
-
65
-
66
-
67
-
68
-
69
-
70
-
71
-
72
-
73
-
74
-
75
-
76
-
77
-
78
-
79
-
80
-
81
-
82
-
83
-
84
-
85
-
86
-
87
-
88
-
89
-
90
-
91
-
92
-
93
-
94
-
95
-
96
-
97
-
98
-
99
-
100
-
101
-
102
-
103
-
104
-
105
-
106
-
107
-
108
-
109
-
110
-
111
-
112
-
113
-
114
-
115
-
116
-
117
-
118
-
119
-
120
-
121
-
122
-
123
-
124
-
125
-
126
-
127
-
128
-
129
-
130
-
131
-
132
-
133
-
134
-
135
-
136
-
137
-
138
-
 139
139 -
 140
140 -
 141
141 -
 142
142 -
 143
143 -
 144
144 -
 145
145 -
 146
146 -
 147
147 -
 148
148 -
 149
149 -
 150
150 -
 151
151 -
 152
152 -
 153
153 -
 154
154 -
 155
155 -
 156
156 -
 157
157 -
 158
158 -
 159
159 -
160
-
161
-
162
-
163
-
164
-
165
-
166
-
167
-
168
-
169
-
170
-
171
-
172
-
173
-
174
-
175
-
176
-
177
-
178
-
179
-
180
-
181
-
182
-
183
-
184
-
185
-
186
-
187
-
188
-
189
-
190
-
191
-
192
-
193
-
194
-
195
-
196
-
197
-
198
-
199
-
200
-
201
-
202
-
203
-
204
-
205
-
206
-
207
-
208
-
209
-
210
-
211
-
212
-
213
-
214
-
215
-
216
 |
 |

147
Financial statements
NOKIA IN 2014
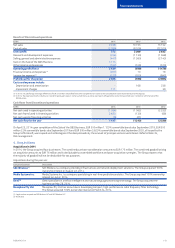
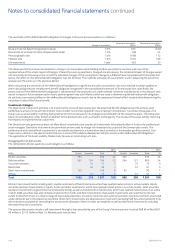
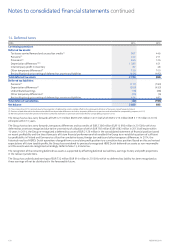
Present value of obligations include EUR 407 million (EUR 425 million in 2013) of wholly funded obligations, EUR 1 408 million (EUR 979 million
in2013) of partly funded obligations and EUR 69 million (EUR 49 million in 2013) of unfunded obligations.
Amounts included in personnel expenses in the consolidated income statement are as follows for the years ended December 31 (Continuing
operations in 2014 and 2013 and the Group in 2012):
EURm 2014 2013 2012
Current service cost 39 44 58
Past service cost and gains and losses on curtailments -(5) (23)
Net interest cost 711 5
Settlements (1) (4) (3)
Total 45 46 37
Movements in pension remeasurements recognized in other comprehensive income for the years ended December 31 (Continuing operations
in 2014 and 2013 and the Group in 2012) are:
EURm 2014 2013 2012
Return on plan assets (excluding interest income), gain 44 15 62
Changes in demographic assumptions, (loss)/gain (1) 4 –
Changes in nancial assumptions, (loss)/gain (321) 93 (264)
Experience adjustments, (loss)/gain (16) 6(25)
Current year change in asset ceiling 4(4) (1)
Total (290) 114 (228)
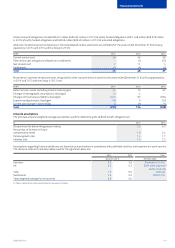
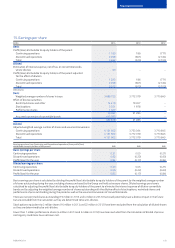
Actuarial assumptions
The principal actuarial weighted average assumptions used for determining the dened benet obligation are:
%2014 2013
Discount rate for determining present values 2.6 4.0
Annual rate of increase in future
compensation levels 1.9 2.4
Pension growth rate 1.4 1.7
Ination rate 1.6 2.0
Assumptions regarding future mortality are set based on actuarial advice in accordance with published statistics and experience in each country.
The discount rates and mortality tables used for the signicant plans are:
2014 2013 2014
Discount rate % Mortality table
Germany 2.0 3.6 Richttafeln 2005 G
UK 3.5 4.5 S2PA table adjusted(1)
India 7.9 9.0 IALM (2006-08)
Ultimate
Switzerland 0.9 2.2 BVG2010G
Total weighted average for all countries 2.6 4.0
(1) Tables unadjusted for males and rated down by two years for females.