Nokia 2014 Annual Report Download - page 52
Download and view the complete annual report
Please find page 52 of the 2014 Nokia annual report below. You can navigate through the pages in the report by either clicking on the pages listed below, or by using the keyword search tool below to find specific information within the annual report.-
 1
1 -
2
-
3
-
4
-
5
-
6
-
7
-
8
-
9
-
10
-
11
-
12
-
13
-
14
-
15
-
16
-
17
-
18
-
19
-
20
-
21
-
22
-
23
-
24
-
25
-
26
-
27
-
28
-
29
-
30
-
31
-
32
-
33
-
34
-
35
-
36
-
37
-
38
-
39
-
40
-
41
-
 42
42 -
 43
43 -
 44
44 -
 45
45 -
 46
46 -
 47
47 -
 48
48 -
 49
49 -
 50
50 -
 51
51 -
 52
52 -
 53
53 -
 54
54 -
 55
55 -
 56
56 -
 57
57 -
 58
58 -
 59
59 -
 60
60 -
 61
61 -
 62
62 -
63
-
64
-
65
-
66
-
67
-
68
-
69
-
70
-
71
-
72
-
73
-
74
-
75
-
76
-
77
-
78
-
79
-
80
-
81
-
82
-
83
-
84
-
85
-
86
-
87
-
88
-
89
-
90
-
91
-
92
-
93
-
94
-
95
-
96
-
97
-
98
-
99
-
100
-
101
-
102
-
103
-
104
-
105
-
106
-
107
-
108
-
109
-
110
-
111
-
112
-
113
-
114
-
115
-
116
-
117
-
118
-
119
-
120
-
121
-
122
-
123
-
124
-
125
-
126
-
127
-
128
-
129
-
130
-
131
-
132
-
133
-
134
-
135
-
136
-
137
-
138
-
139
-
140
-
141
-
142
-
143
-
144
-
145
-
146
-
147
-
148
-
149
-
150
-
151
-
152
-
153
-
154
-
155
-
156
-
157
-
158
-
159
-
160
-
161
-
162
-
163
-
164
-
165
-
166
-
167
-
168
-
169
-
170
-
171
-
172
-
173
-
174
-
175
-
176
-
177
-
178
-
179
-
180
-
181
-
182
-
183
-
184
-
185
-
186
-
187
-
188
-
189
-
190
-
191
-
192
-
193
-
194
-
195
-
196
-
197
-
198
-
199
-
200
-
201
-
202
-
203
-
204
-
205
-
206
-
207
-
208
-
209
-
210
-
211
-
212
-
213
-
214
-
215
-
216
 |
 |

50 NOKIA IN 2014
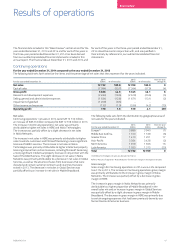
Results of operations continued
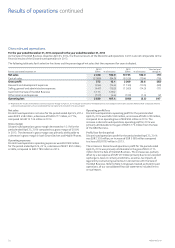
Net sales
Continuing operations’ net sales declined by 17% to EUR 12 709
million in 2013 compared with EUR 15 400 million in 2012. The decline
in Continuing operations’ net sales in 2013 was primarily due to lower
Nokia Networks and HERE net sales. The decline in Nokia Networks’ net
sales was partially due to divestments of businesses not consistent
with its strategic focus, as well as the exiting of certain customer
contracts and countries. Excluding these two factors, Nokia Networks’
net sales in 2013 declined by approximately 13% primarily due to
reduced wireless infrastructure deployment activity, which aected
both Global Services and Mobile Broadband. The decline in HERE
net sales was primarily due to a decline in internal* HERE net sales
due tolower recognition of deferred revenue related to our
smartphone sales, partially oset by an increase in external HERE
net sales due tohigher sales to vehicle customers. Additionally,
Nokia Networks’ andHERE net sales were adversely aected by
foreign currency uctuations.
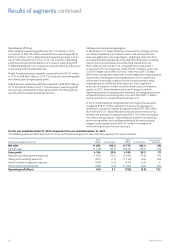
The following table sets forth the distribution by geographical area
ofour net sales for the scal years 2013 and 2012.
For the year ended December 31
2013
EURm
2012
EURm
Year-on-year
change %
Europe(1) 3 940 4 892 (19)
Middle East & Africa 1 169 1 362 (14)
Greater China 1 201 1 341 (10)
Asia-Pacic 3 428 4 429 (23)
North America 1 656 1 628 2
Latin America 1 315 1 748 (25)
Total 12 709 15 400 (17)
(1) All Nokia Technologies net sales are allocated to Finland.
* HERE internal sales refers to sales that HERE had to our Discontinued operations (formerly
Devices & Services business) that used certain HERE services in its mobile devices. After the
closing of the Sale of the D&S Business, HERE no longer generates such internal sales, however,
it will continue to recognize deferred revenue related to this business for up to 24 months after
the closing of the Sale of the D&S Business. As part of the Sale of the D&S Business, Microsoft
will become a strategic licensee of the HERE platform, and will separately pay HERE for a
four-year license that will be recognized ratably as external net sales.
Gross margin
Gross margin for Continuing operations in 2013 was 42.1%, compared
to 36.1% in 2012. The increase in 2013 was primarily due to a higher
Nokia Networks’ gross margin. Nokia Networks’ gross margin increased
primarily due to improved eciency in Global Services, an improved
product mix with a greater share of higher margin products, and the
divestment of less protable businesses.
Operating expenses
Our R&D expenses were EUR 2 619 million in 2013, compared to
EUR 3 081 million in 2012. R&D expenses represented 20.6% of
our net sales in 2013, compared to 20.0% in 2012. R&D expenses
included purchase price accounting items of EUR 188 million in 2013,
compared to EUR 375 million in 2012. The decrease was primarily
dueto lower amortization of acquired intangible assets within HERE.
Inaddition, it included EUR 15 million of transaction related costs,
related to the Sale of the D&S Business.
In 2013, our selling and marketing expenses were EUR 974 million,
compared to EUR 1 372 million in 2012. Selling and marketing
expenses represented 7.7% of our net sales in 2013 compared to
8.9% in 2012. The decrease in selling and marketing expenses was due
to lower purchase price accounting items and generally lower expenses
in Nokia Networks and HERE. Selling and marketing expenses included
purchase price accounting items of EUR 93 million in 2013 compared
to EUR 313 million in 2012. The decrease was primarily due to items
arising from the formation of Nokia Networks becoming fully
amortized at the end of the rst quarter of 2013.
Administrative and general expenses were EUR 697 million in 2013,
compared to EUR 690 million in 2012. Administrative and general
expenses were equal to 5.5% of our net sales in 2013 compared to
4.5% in 2012. The increase in administrative and general expenses
asa percentage of net sales reected a decline in net sales in 2013.
Administrative and general expenses did not include purchase price
accounting items in either 2013 or 2012.
Other income and expenses was a net expense of EUR 536 million
in 2013, compared to a net expense of EUR 1 237 million in 2012.
In 2013, other income and expenses included restructuring charges of
EUR 602 million, as well as transaction related costs of EUR 18 million
related to the Sale of the D&S Business. In 2012, other income and
expenses included restructuring charges of EUR 1 265 million,
including EUR 42 million related to country and contract exits,
impairments of assets of EUR 2 million, a negative adjustment of
EUR 4 million to purchase price allocations related to the nal payment
from Motorola as well as amortization of acquired intangible assets of
EUR 23 million and a net gain on sale of real estate of EUR 79 million.