Nokia 2014 Annual Report Download - page 59
Download and view the complete annual report
Please find page 59 of the 2014 Nokia annual report below. You can navigate through the pages in the report by either clicking on the pages listed below, or by using the keyword search tool below to find specific information within the annual report.-
 1
1 -
2
-
3
-
4
-
5
-
6
-
7
-
8
-
9
-
10
-
11
-
12
-
13
-
14
-
15
-
16
-
17
-
18
-
19
-
20
-
21
-
22
-
23
-
24
-
25
-
26
-
27
-
28
-
29
-
30
-
31
-
32
-
33
-
34
-
35
-
36
-
37
-
38
-
39
-
40
-
41
-
42
-
43
-
44
-
45
-
46
-
47
-
48
-
 49
49 -
 50
50 -
 51
51 -
 52
52 -
 53
53 -
 54
54 -
 55
55 -
 56
56 -
 57
57 -
 58
58 -
 59
59 -
 60
60 -
 61
61 -
 62
62 -
 63
63 -
 64
64 -
 65
65 -
 66
66 -
 67
67 -
 68
68 -
 69
69 -
70
-
71
-
72
-
73
-
74
-
75
-
76
-
77
-
78
-
79
-
80
-
81
-
82
-
83
-
84
-
85
-
86
-
87
-
88
-
89
-
90
-
91
-
92
-
93
-
94
-
95
-
96
-
97
-
98
-
99
-
100
-
101
-
102
-
103
-
104
-
105
-
106
-
107
-
108
-
109
-
110
-
111
-
112
-
113
-
114
-
115
-
116
-
117
-
118
-
119
-
120
-
121
-
122
-
123
-
124
-
125
-
126
-
127
-
128
-
129
-
130
-
131
-
132
-
133
-
134
-
135
-
136
-
137
-
138
-
139
-
140
-
141
-
142
-
143
-
144
-
145
-
146
-
147
-
148
-
149
-
150
-
151
-
152
-
153
-
154
-
155
-
156
-
157
-
158
-
159
-
160
-
161
-
162
-
163
-
164
-
165
-
166
-
167
-
168
-
169
-
170
-
171
-
172
-
173
-
174
-
175
-
176
-
177
-
178
-
179
-
180
-
181
-
182
-
183
-
184
-
185
-
186
-
187
-
188
-
189
-
190
-
191
-
192
-
193
-
194
-
195
-
196
-
197
-
198
-
199
-
200
-
201
-
202
-
203
-
204
-
205
-
206
-
207
-
208
-
209
-
210
-
211
-
212
-
213
-
214
-
215
-
216
 |
 |

57
Board review
NOKIA IN 2014
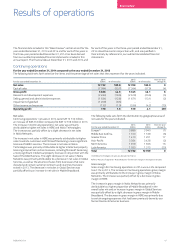
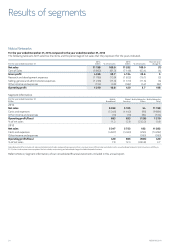
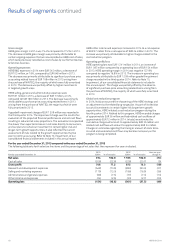
Segment information
For the year ended December 31
EURm
Mobile
Broadband
Global
Services
Nokia
Networks
Other
Nokia
Networks
Total
2013
Net sales 5 347 5 753 182 11 282
Contribution 420 693 (693) –
% of net sales 7.9 12.0 (381.9)
Operating prot 420
% of net sales 3.7
2012
Net sales 6 043 6 929 807 13 779
Contribution 490 334 (1 619) –
% of net sales 8.1 4.8 (200.6)
Operating loss (795)
% of net sales (5.8)
Nokia Networks Other includes net sales and related cost of sales and operating expenses of non-core businesses, IPR net sales and related costs, as well as Nokia Networks’ Optical business until May 6,
2013, when its divestment was completed. It also includes restructuring and associated charges for Nokia Networks business.
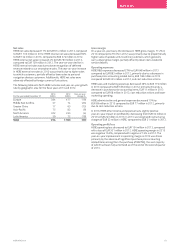
Net sales
Nokia Networks net sales decreased 18% to EUR 11 282 million in
2013, compared to EUR 13 779 million in 2012. The year-on-year
decline in Nokia Networks net sales was primarily due to reduced
wireless infrastructure deployment activity aecting both Mobile
Broadband and Global Services, as well as the divestments of
businesses not consistent with its strategic focus, foreign
currency uctuations and the exiting of certain customer
contracts and countries.
Mobile Broadband net sales declined 12% to EUR 5 347 million in
2013, compared to EUR 6 043 million in 2012, as declines in WCDMA,
CDMA and GSM were partially oset by growth in both FD-LTE and
TD-LTE, reecting the industry shift to 4G technology. Core network
sales declined as a result of the customer focus on radio technologies.
Global Services net sales declined 17% to EUR 5 753 million in 2013,
compared to EUR 6 929 million in 2012 primarily due to the exiting of
certain customer contracts and countries as part of Nokia Networks
strategy to focus on more protable business as well as a decline in
network roll-outs in Japan and Europe.
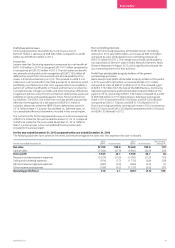
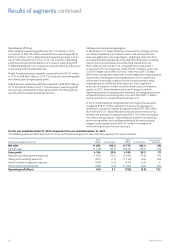
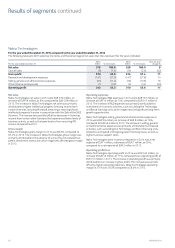
The following table sets forth the distribution by geographical area
ofnet sales for the years indicated.
For the year ended December 31
2013
EURm
2012
EURm
Year-on-year
change %
Europe 3 041 3 896 (22)
Middle East & Africa 1 111 1 287 (14)
Greater China 1 185 1 278 (7)
Asia-Pacic 3 354 4 347 (23)
North America 1 334 1 294 3
Latin America 1 257 1 677 (25)
Total 11 282 13 779 (18)
Gross margin
Nokia Networks gross margin was 36.6% in 2013, compared to 30.3%
in 2012, driven by improved eciency in Global Services, an improved
product mix with a greater share of higher margin products, and the
divestment of less protable businesses.
In Mobile Broadband, gross margin improved in 2013 driven by an
increased software share in the product mix, oset by costs incurred
in anticipation of a technology shift to TD-LTE.
In Global Services, gross margin improved signicantly in 2013 due
tothe increase in eciencies as part of our restructuring program
andthe exit of certain customer contracts and countries as part
ofNokia Networks strategy to focus on more protable business.