Nokia 2014 Annual Report Download - page 159
Download and view the complete annual report
Please find page 159 of the 2014 Nokia annual report below. You can navigate through the pages in the report by either clicking on the pages listed below, or by using the keyword search tool below to find specific information within the annual report.-
 1
1 -
2
-
3
-
4
-
5
-
6
-
7
-
8
-
9
-
10
-
11
-
12
-
13
-
14
-
15
-
16
-
17
-
18
-
19
-
20
-
21
-
22
-
23
-
24
-
25
-
26
-
27
-
28
-
29
-
30
-
31
-
32
-
33
-
34
-
35
-
36
-
37
-
38
-
39
-
40
-
41
-
42
-
43
-
44
-
45
-
46
-
47
-
48
-
49
-
50
-
51
-
52
-
53
-
54
-
55
-
56
-
57
-
58
-
59
-
60
-
61
-
62
-
63
-
64
-
65
-
66
-
67
-
68
-
69
-
70
-
71
-
72
-
73
-
74
-
75
-
76
-
77
-
78
-
79
-
80
-
81
-
82
-
83
-
84
-
85
-
86
-
87
-
88
-
89
-
90
-
91
-
92
-
93
-
94
-
95
-
96
-
97
-
98
-
99
-
100
-
101
-
102
-
103
-
104
-
105
-
106
-
107
-
108
-
109
-
110
-
111
-
112
-
113
-
114
-
115
-
116
-
117
-
118
-
119
-
120
-
121
-
122
-
123
-
124
-
125
-
126
-
127
-
128
-
129
-
130
-
131
-
132
-
133
-
134
-
135
-
136
-
137
-
138
-
139
-
140
-
141
-
142
-
143
-
144
-
145
-
146
-
147
-
148
-
 149
149 -
 150
150 -
 151
151 -
 152
152 -
 153
153 -
 154
154 -
 155
155 -
 156
156 -
 157
157 -
 158
158 -
 159
159 -
 160
160 -
 161
161 -
 162
162 -
 163
163 -
 164
164 -
 165
165 -
 166
166 -
 167
167 -
 168
168 -
 169
169 -
170
-
171
-
172
-
173
-
174
-
175
-
176
-
177
-
178
-
179
-
180
-
181
-
182
-
183
-
184
-
185
-
186
-
187
-
188
-
189
-
190
-
191
-
192
-
193
-
194
-
195
-
196
-
197
-
198
-
199
-
200
-
201
-
202
-
203
-
204
-
205
-
206
-
207
-
208
-
209
-
210
-
211
-
212
-
213
-
214
-
215
-
216
 |
 |

157
Financial statements
NOKIA IN 2014
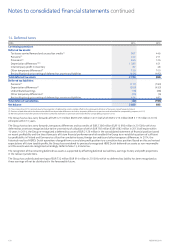
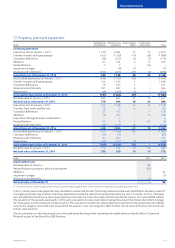
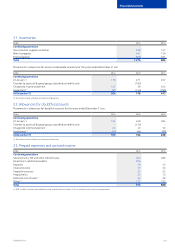
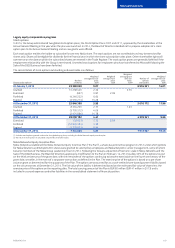
17. Property, plant and equipment
EURm
Buildings and
constructions
Machinery and
equipment
Other tangible
assets(1)
Assets under
construction Total
Continuing operations
Acquisition cost at January 1, 2013 1 129 3 694 77 73 4 973
Transfer to assets of disposal groups (422) (1 528) (10) (38) (1 998)
Translation dierences (44) (122) (3) (5) (174)
Additions 21 154 411 190
Reclassications 7 7 – (14) –
Impairment charges –(6) (1) –(7)
Disposals and retirements (355) (451) (27) (3) (836)
Acquisition cost at December 31, 2013 336 1 748 40 24 2 148
Accumulated depreciation at January 1, 2013 (469) (3 043) (30) –(3 542)
Transfer to assets of disposal groups 150 1 335 4 – 1 489
Translation dierences 19 107 1 – 127
Disposals and retirements 191 397 6 – 594
Depreciation (48) (200) (2) –(250)
Accumulated depreciation at December 31, 2013 (157) (1 404) (21) –(1 582)
Net book value at January 1, 2013 660 651 47 73 1 431
Net book value at December 31, 2013 179 344 19 24 566
Acquisition cost at January 1, 2014 336 1 748 40 24 2 148
Transfers from assets held for sale 76 3 4 – 83
Translation dierences 25 103 – 1 129
Additions 28 205 –15 248
Acquisitions through business combinations – 2 – – 2
Reclassications 12 6 1 (21) (2)
Disposals and retirements (39) (213) (4) –(256)
Acquisition cost at December 31, 2014 438 1 854 41 19 2 352
Accumulated depreciation at January 1, 2014 (157) (1 404) (21) –(1 582)
Translation dierences (13) (75) 1 – (87)
Disposals and retirements 30 202 – – 232
Depreciation (40) (157) (2) –(199)
Accumulated depreciation at December 31, 2014 (180) (1 434) (22) –(1 636)
Net book value at January 1, 2014 179 344 19 24 566
Net book value at December 31, 2014 258 420 19 19 716
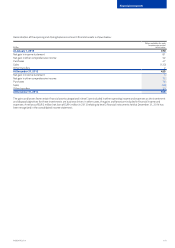
EURm 2014 2013
Assets held for sale
Net book value at January 1 89 –
Reclassications to property, plant and equipment (83) –
Additions –94
Impairment charges –(5)
Disposals and retirements (6) –
Net book value at December 31 –89
(1) Land and water areas and other tangible assets have been combined as other tangible assets in 2014 and have been combined for comparability purposes in 2013.
In 2013, certain real estate properties were classied as assets held for sale. These long-lived assets had been identied for disposal as part of
the ongoing restructuring activities. The Group expected to realize the sale of these properties within the next 12 months. In 2014, the Group
has concluded that there are no real estate properties that meet the criteria for assets held for sale (the fair value in 2013 was EUR 89 million).
The valuation of these assets was based on third-party evaluations by real estate brokers taking into account the Group’s divestment strategy
for these assets as well as relevant market dynamics. This evaluation included non-observable inputs and hence these assets were considered
to be level 3 category assets that were measured at fair value on a non-recurring basis. Refer to Note 19, Fair value of nancial instruments for
the fair value hierarchy.
The tax authorities in India have placed a lien which prohibited the Group from transfering the mobile devices related facility in Chennai to
Microsoft as part of the Sale of the D&S Business.