Nokia 2014 Annual Report Download - page 50
Download and view the complete annual report
Please find page 50 of the 2014 Nokia annual report below. You can navigate through the pages in the report by either clicking on the pages listed below, or by using the keyword search tool below to find specific information within the annual report.-
 1
1 -
2
-
3
-
4
-
5
-
6
-
7
-
8
-
9
-
10
-
11
-
12
-
13
-
14
-
15
-
16
-
17
-
18
-
19
-
20
-
21
-
22
-
23
-
24
-
25
-
26
-
27
-
28
-
29
-
30
-
31
-
32
-
33
-
34
-
35
-
36
-
37
-
38
-
39
-
 40
40 -
 41
41 -
 42
42 -
 43
43 -
 44
44 -
 45
45 -
 46
46 -
 47
47 -
 48
48 -
 49
49 -
 50
50 -
 51
51 -
 52
52 -
 53
53 -
 54
54 -
 55
55 -
 56
56 -
 57
57 -
 58
58 -
 59
59 -
 60
60 -
61
-
62
-
63
-
64
-
65
-
66
-
67
-
68
-
69
-
70
-
71
-
72
-
73
-
74
-
75
-
76
-
77
-
78
-
79
-
80
-
81
-
82
-
83
-
84
-
85
-
86
-
87
-
88
-
89
-
90
-
91
-
92
-
93
-
94
-
95
-
96
-
97
-
98
-
99
-
100
-
101
-
102
-
103
-
104
-
105
-
106
-
107
-
108
-
109
-
110
-
111
-
112
-
113
-
114
-
115
-
116
-
117
-
118
-
119
-
120
-
121
-
122
-
123
-
124
-
125
-
126
-
127
-
128
-
129
-
130
-
131
-
132
-
133
-
134
-
135
-
136
-
137
-
138
-
139
-
140
-
141
-
142
-
143
-
144
-
145
-
146
-
147
-
148
-
149
-
150
-
151
-
152
-
153
-
154
-
155
-
156
-
157
-
158
-
159
-
160
-
161
-
162
-
163
-
164
-
165
-
166
-
167
-
168
-
169
-
170
-
171
-
172
-
173
-
174
-
175
-
176
-
177
-
178
-
179
-
180
-
181
-
182
-
183
-
184
-
185
-
186
-
187
-
188
-
189
-
190
-
191
-
192
-
193
-
194
-
195
-
196
-
197
-
198
-
199
-
200
-
201
-
202
-
203
-
204
-
205
-
206
-
207
-
208
-
209
-
210
-
211
-
212
-
213
-
214
-
215
-
216
 |
 |
48 NOKIA IN 2014
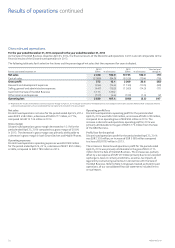
Operating expenses
Our R&D expenses for Continuing operations in 2014 were EUR 2 493
million, a decrease of EUR 126 million, or 5%, compared to EUR 2 619
million in 2013. R&D expenses represented 19.6% of our net sales
in 2014 compared to 20.6% in 2013. The decrease in R&D expenses
was primarily attributable to the decrease in R&D expenses in HERE
and Nokia Networks, partially oset by higher R&D expenses in
Nokia Technologies.
The decrease in R&D expenses in HERE was primarily attributable to
signicant purchase price accounting related items of EUR 168 million
in 2013 arising from the purchase of NAVTEQ, the majority of which
were fully amortized in 2013. The decrease in R&D expenses in Nokia
Networks was primarily attributable to lower subcontracting costs,
partially oset by higher investments in targeted growth areas,
most notably LTE, small cells and Telco Cloud. The increase in R&D
expenses in Nokia Technologies was primarily attributable to
investments in business activities, such as the Technology and Brand
licensing opportunities, which target new and signicant long-term
growth opportunities.
R&D expenses included purchase price accounting related items of
EUR 36 million in 2014 compared to EUR 188 million in 2013. In 2014,
R&D expenses included EUR 23 million of transaction related
personnel costs related to the Sale of the D&S Business compared
to EUR 15 million in 2013.
Our selling, general and administrative expenses for Continuing
operations in 2014 were EUR 1 634 million, a decrease of
EUR 37 million, or 2%, compared to EUR 1 671 million in 2013. Selling,
general and administrative expenses represented 12.8% of our net
sales in 2014 compared to 13.1% in 2013. The decrease in selling,
general and administrative expenses was primarily attributable to
the decrease in selling, general and administrative expenses in Nokia
Networks. The decrease was partially oset by an increase in selling,
general and administrative expenses in Group Common Functions
and Nokia Technologies.
The decrease in selling, general and administrative expenses in Nokia
Networks was primarily attributable to structural cost savings from
Nokia Networks’ global restructuring program. The increase in selling,
general and administrative expenses in Group Common Functions
was primarily attributable to transaction related costs resulting from
the Sale of the D&S Business. The increase in selling, general and
administrative expenses in Nokia Technologies was primarily
attributable to increased activities related to anticipated and
ongoing patent licensing cases.
Selling, general and administrative expenses included purchase
price accounting items of EUR 40 million in 2014 compared to
EUR 93 million in 2013. In 2014, selling, general and administrative
expenses included EUR 31 million of transaction related costs related
to the Sale of the D&S Business.
A goodwill impairment charge of EUR 1 209 million was recorded in the
third quarter 2014. Refer to Note 10, Impairment, of our consolidated
nancial statements included in this annual report.
Other income and expenses for Continuing operations in 2014 was a
net expense of EUR 132 million, a decrease of EUR 404 million, or 75%,
compared to a net expense of EUR 536 million in 2013. The decrease
in other income and expenses was primarily attributable to lower
restructuring and associated charges at Nokia Networks, partially
oset by lower other income in Group Common Functions. In 2014,
other income and expenses included restructuring and associated
charges of EUR 57 million at Nokia Networks, charges related to the
HERE cost reduction program of EUR 36 million and anticipated
contractual remediation costs of EUR 31 million at Nokia Networks.
In2013, other income and expenses included restructuring and
associated charges of EUR 602 million, and transaction related costs
ofEUR 18 million related to the Sale of the D&S Business.
Operating prot/loss
Our operating prot for Continuing operations in 2014 was
EUR 170 million, a decrease of EUR 349 million, or 67%, compared
to an operating prot of EUR 519 million in 2013. The decrease in
operating prot was primarily attributable to the goodwill impairment
charge relating to HERE and the higher expenses in Group Common
Functions. The decrease was partially oset by an increase in operating
prot in Nokia Networks and Nokia Technologies. Our operating prot
in 2014 included a EUR 1 209 million goodwill impairment charge
relating to HERE. In addition, it included purchase price accounting
items, restructuring charges and other special items of EUR 253 million
compared to EUR 917 million in 2013. Our operating margin in 2014
was 1.3% compared to 4.1% in 2013.
Net nancial income and expenses
Financial income and expenses for Continuing operations was a net
expense of EUR 395 million in 2014 compared to a net expense of
EUR280 million in 2013, an increase of EUR 115 million, or 41%.
The higher net nancial expense in 2014 was primarily attributable
to EUR 123 million of one-time expense related to the redemption of
materially all of Nokia Networks’ borrowings, and a non-cash charge of
EUR 57 million related to the repayment of EUR 1.5 billion convertible
bonds issued to Microsoft in the second quarter 2014. These charges
were partially oset by reduced interest expenses during the second
half of the year and lower net losses related to foreign exchange.
Refer to “ —Liquidity and capital resources” below.
Results of operations continued