Nokia 2014 Annual Report Download - page 61
Download and view the complete annual report
Please find page 61 of the 2014 Nokia annual report below. You can navigate through the pages in the report by either clicking on the pages listed below, or by using the keyword search tool below to find specific information within the annual report.-
 1
1 -
2
-
3
-
4
-
5
-
6
-
7
-
8
-
9
-
10
-
11
-
12
-
13
-
14
-
15
-
16
-
17
-
18
-
19
-
20
-
21
-
22
-
23
-
24
-
25
-
26
-
27
-
28
-
29
-
30
-
31
-
32
-
33
-
34
-
35
-
36
-
37
-
38
-
39
-
40
-
41
-
42
-
43
-
44
-
45
-
46
-
47
-
48
-
49
-
50
-
 51
51 -
 52
52 -
 53
53 -
 54
54 -
 55
55 -
 56
56 -
 57
57 -
 58
58 -
 59
59 -
 60
60 -
 61
61 -
 62
62 -
 63
63 -
 64
64 -
 65
65 -
 66
66 -
 67
67 -
 68
68 -
 69
69 -
 70
70 -
 71
71 -
72
-
73
-
74
-
75
-
76
-
77
-
78
-
79
-
80
-
81
-
82
-
83
-
84
-
85
-
86
-
87
-
88
-
89
-
90
-
91
-
92
-
93
-
94
-
95
-
96
-
97
-
98
-
99
-
100
-
101
-
102
-
103
-
104
-
105
-
106
-
107
-
108
-
109
-
110
-
111
-
112
-
113
-
114
-
115
-
116
-
117
-
118
-
119
-
120
-
121
-
122
-
123
-
124
-
125
-
126
-
127
-
128
-
129
-
130
-
131
-
132
-
133
-
134
-
135
-
136
-
137
-
138
-
139
-
140
-
141
-
142
-
143
-
144
-
145
-
146
-
147
-
148
-
149
-
150
-
151
-
152
-
153
-
154
-
155
-
156
-
157
-
158
-
159
-
160
-
161
-
162
-
163
-
164
-
165
-
166
-
167
-
168
-
169
-
170
-
171
-
172
-
173
-
174
-
175
-
176
-
177
-
178
-
179
-
180
-
181
-
182
-
183
-
184
-
185
-
186
-
187
-
188
-
189
-
190
-
191
-
192
-
193
-
194
-
195
-
196
-
197
-
198
-
199
-
200
-
201
-
202
-
203
-
204
-
205
-
206
-
207
-
208
-
209
-
210
-
211
-
212
-
213
-
214
-
215
-
216
 |
 |

59
Board review
NOKIA IN 2014
HERE
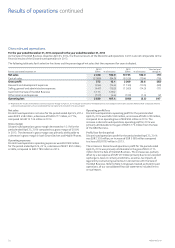
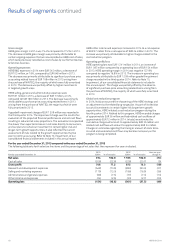
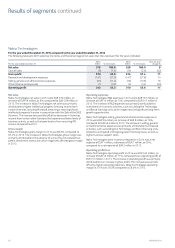
For the year ended December 31, 2014 compared to the year ended December 31, 2013
The following table sets forth selective line items and the percentage of net sales that they represent for the years indicated.
For the year ended December 31
2014
EURm % of net sales
2013
EURm % of net sales
Year-on-year
change %
Net sales 970 100.0 914 100.0 6
Cost of sales (239) (24.6) (208) (22.8) 15
Gross prot 731 75.4 706 77.2 4
Research and development expenses (545) (56.2) (648) (70.9) (16)
Selling, general and administrative expenses (181) (18.7) (188) (20.6) (4)
Impairment of goodwill (1 209) (124.6) –––
Other income and expenses (37) (3.8) (24) (2.6) 54
Operating loss (1 241) (127.9) (154) (16.8) 706
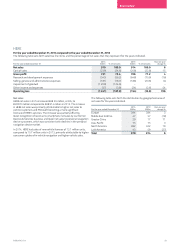
Net sales
HERE net sales in 2014 increased EUR 56 million, or 6%, to
EUR 970 million compared to EUR 914 million in 2013. The increase
in HERE net sales was primarily attributable to higher net sales to
vehicle customers and Microsoft becoming a more signicant
licensee of HERE’s services. The increase was partially oset by
lower recognition of revenue to smartphone net sales by our former
Devices & Services business and lower net sales to personal navigation
device customers, which was consistent with declines in the personal
navigation device market.
In 2014, HERE had sales of new vehicle licenses of 13.1 million units,
compared to 10.7 million units in 2013, primarily attributable to higher
consumer uptake of in-vehicle navigation and higher vehicle sales.
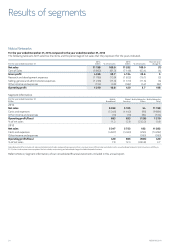
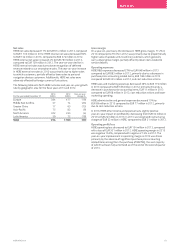
The following table sets forth the distribution by geographical area of
net sales for the years indicated.
For the year ended December 31
2014
EURm
2013
EURm
Year-on-year
change %
Europe 394 384 3
Middle East & Africa 47 57 (18)
Greater China 29 17 71
Asia-Pacic 75 75 0
North America 382 322 19
Latin America 43 59 (27)
Total 970 914 6