Nokia 2014 Annual Report Download - page 63
Download and view the complete annual report
Please find page 63 of the 2014 Nokia annual report below. You can navigate through the pages in the report by either clicking on the pages listed below, or by using the keyword search tool below to find specific information within the annual report.-
 1
1 -
2
-
3
-
4
-
5
-
6
-
7
-
8
-
9
-
10
-
11
-
12
-
13
-
14
-
15
-
16
-
17
-
18
-
19
-
20
-
21
-
22
-
23
-
24
-
25
-
26
-
27
-
28
-
29
-
30
-
31
-
32
-
33
-
34
-
35
-
36
-
37
-
38
-
39
-
40
-
41
-
42
-
43
-
44
-
45
-
46
-
47
-
48
-
49
-
50
-
51
-
52
-
 53
53 -
 54
54 -
 55
55 -
 56
56 -
 57
57 -
 58
58 -
 59
59 -
 60
60 -
 61
61 -
 62
62 -
 63
63 -
 64
64 -
 65
65 -
 66
66 -
 67
67 -
 68
68 -
 69
69 -
 70
70 -
 71
71 -
 72
72 -
 73
73 -
74
-
75
-
76
-
77
-
78
-
79
-
80
-
81
-
82
-
83
-
84
-
85
-
86
-
87
-
88
-
89
-
90
-
91
-
92
-
93
-
94
-
95
-
96
-
97
-
98
-
99
-
100
-
101
-
102
-
103
-
104
-
105
-
106
-
107
-
108
-
109
-
110
-
111
-
112
-
113
-
114
-
115
-
116
-
117
-
118
-
119
-
120
-
121
-
122
-
123
-
124
-
125
-
126
-
127
-
128
-
129
-
130
-
131
-
132
-
133
-
134
-
135
-
136
-
137
-
138
-
139
-
140
-
141
-
142
-
143
-
144
-
145
-
146
-
147
-
148
-
149
-
150
-
151
-
152
-
153
-
154
-
155
-
156
-
157
-
158
-
159
-
160
-
161
-
162
-
163
-
164
-
165
-
166
-
167
-
168
-
169
-
170
-
171
-
172
-
173
-
174
-
175
-
176
-
177
-
178
-
179
-
180
-
181
-
182
-
183
-
184
-
185
-
186
-
187
-
188
-
189
-
190
-
191
-
192
-
193
-
194
-
195
-
196
-
197
-
198
-
199
-
200
-
201
-
202
-
203
-
204
-
205
-
206
-
207
-
208
-
209
-
210
-
211
-
212
-
213
-
214
-
215
-
216
 |
 |

61
Board review
NOKIA IN 2014
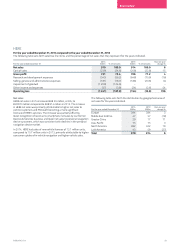
Net sales
HERE net sales decreased 17% to EUR 914 million in 2013, compared
to EUR 1 103 million in 2012. HERE internal net sales decreased 59%
to EUR 154 million in 2013, compared to EUR 374 million in 2012.
HERE external net sales increased 4% to EUR 760 million in 2013,
compared to EUR 729 million in 2012. The year-on-year decline in
HERE internal net sales was due to lower recognition of deferred
revenue related to our smartphone sales. The year-on-year increase
inHERE external net sales in 2013 was primarily due to higher sales
tovehicle customers, partially oset by lower sales to personal
navigation devices customers. Additionally, HERE net sales were
adversely aected by foreign currency uctuations.
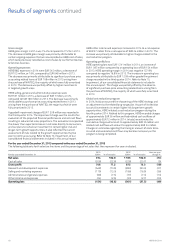
The following table sets forth HERE net sales and year-on-year growth
rate by geographic area for the scal years 2013 and 2012.
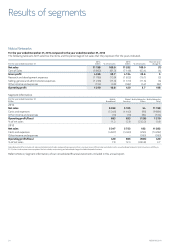
For the year ended December 31
2013
EURm
2012
EURm
Year-on-year
change %
Europe 384 477 (19)
Middle East & Africa 57 74 (23)
Greater China 17 63 (73)
Asia-Pacic 75 82 (9)
North America 322 335 (4)
Latin America 59 72 (18)
Total 914 1 103 (17)
Gross margin
On a year-on-year basis, the decrease in HERE gross margin, 77.2% in
2013 compared to 79.3% in 2012, was primarily due to proportionally
higher sales of update units to vehicle customers, which generally
carry a lower gross margin, partially oset by lower costs related to
service delivery.
Operating expenses
HERE R&D expenses decreased 27% to EUR 648 million in 2013
compared to EUR 883 million in 2012, primarily due to a decrease in
purchase price accounting related items, EUR 168 million in 2013
compared to EUR 355 million in 2012, and cost reduction actions.
HERE sales and marketing expenses decreased 36% to EUR 119 million
in 2013 compared to EUR 186 million in 2012, primarily driven by a
decrease in purchase price accounting items, EUR 11 million in 2013
compared to EUR 68 million in 2012, cost reduction actions and lower
marketing spending.
HERE administrative and general expenses decreased 10% to
EUR 69 million in 2013 compared to EUR 77 million in 2012, primarily
due to cost reduction actions.
In 2013, HERE other income and expense had a slightly positive
year-on-year impact on protability, decreasing from EUR 30 million in
2012 to EUR 24 million in 2013. In 2013, we recognized restructuring
charges of EUR 22 million in HERE, compared to EUR 31 million in 2012.
Operating prot/loss
HERE operating loss decreased to EUR 154 million in 2013, compared
with a loss of EUR 301 million in 2012. HERE operating margin in 2013
was negative 16.8%, compared with negative 27.3% in 2012. The
year-on-year improvement in operating margin in 2013 was driven
primarily by the absence of signicant purchase price accounting
related items arising from the purchase of NAVTEQ, the vast majority
of which had been fully amortized as of the end of the second quarter
of 2013.