Nokia 2014 Annual Report Download - page 162
Download and view the complete annual report
Please find page 162 of the 2014 Nokia annual report below. You can navigate through the pages in the report by either clicking on the pages listed below, or by using the keyword search tool below to find specific information within the annual report.-
 1
1 -
2
-
3
-
4
-
5
-
6
-
7
-
8
-
9
-
10
-
11
-
12
-
13
-
14
-
15
-
16
-
17
-
18
-
19
-
20
-
21
-
22
-
23
-
24
-
25
-
26
-
27
-
28
-
29
-
30
-
31
-
32
-
33
-
34
-
35
-
36
-
37
-
38
-
39
-
40
-
41
-
42
-
43
-
44
-
45
-
46
-
47
-
48
-
49
-
50
-
51
-
52
-
53
-
54
-
55
-
56
-
57
-
58
-
59
-
60
-
61
-
62
-
63
-
64
-
65
-
66
-
67
-
68
-
69
-
70
-
71
-
72
-
73
-
74
-
75
-
76
-
77
-
78
-
79
-
80
-
81
-
82
-
83
-
84
-
85
-
86
-
87
-
88
-
89
-
90
-
91
-
92
-
93
-
94
-
95
-
96
-
97
-
98
-
99
-
100
-
101
-
102
-
103
-
104
-
105
-
106
-
107
-
108
-
109
-
110
-
111
-
112
-
113
-
114
-
115
-
116
-
117
-
118
-
119
-
120
-
121
-
122
-
123
-
124
-
125
-
126
-
127
-
128
-
129
-
130
-
131
-
132
-
133
-
134
-
135
-
136
-
137
-
138
-
139
-
140
-
141
-
142
-
143
-
144
-
145
-
146
-
147
-
148
-
149
-
150
-
151
-
 152
152 -
 153
153 -
 154
154 -
 155
155 -
 156
156 -
 157
157 -
 158
158 -
 159
159 -
 160
160 -
 161
161 -
 162
162 -
 163
163 -
 164
164 -
 165
165 -
 166
166 -
 167
167 -
 168
168 -
 169
169 -
 170
170 -
 171
171 -
 172
172 -
173
-
174
-
175
-
176
-
177
-
178
-
179
-
180
-
181
-
182
-
183
-
184
-
185
-
186
-
187
-
188
-
189
-
190
-
191
-
192
-
193
-
194
-
195
-
196
-
197
-
198
-
199
-
200
-
201
-
202
-
203
-
204
-
205
-
206
-
207
-
208
-
209
-
210
-
211
-
212
-
213
-
214
-
215
-
216
 |
 |

160 NOKIA IN 2014
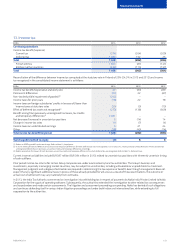
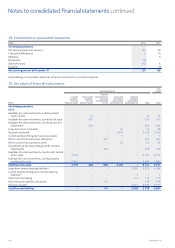
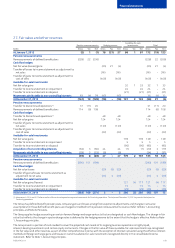
Fair value hierarchy
Financial assets and liabilities recorded at fair value are categorized based on the amount of unobservable inputs used to measure their fair
value. Three hierarchical levels are based on an increasing amount of judgment associated with the inputs used to derive fair value for these
assets and liabilities, level 1 being market values and level 3 requiring most management judgment. At the end of each reporting period, the
Group categorizes its nancial assets and liabilities to appropriate level of fair value hierarchy. Items measured at fair value on a recurring basis
at December 31 are:
EURm
Instruments with
quoted prices in
active markets
(level 1)
Valuation
technique using
observable data
(level 2)
Valuation
technique using
non-observable
data (level 3) Total
Continuing operations
2014
Available-for-sale investments, publicly quoted equity shares 14 – – 14
Available-for-sale investments, carried at fair value 113 556 570
Other current nancial assets, derivatives(1) –241 –241
Investments at fair value through prot and loss, liquid assets 418 – – 418
Available-for-sale investments, liquid assets carried at fair value 2 116 11 –2 127
Available-for-sale investments, cash equivalents carried at fair value 2 643 – – 2 643
Total assets 5 192 265 556 6 013
Other nancial liabilities, derivatives(1) –174 –174
Total liabilities –174 –174
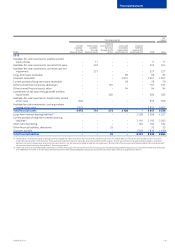
2013
Available-for-sale investments, publicly quoted equity shares 11 – – 11
Available-for-sale investments, carried at fair value 56 18 429 503
Other current nancial assets, derivatives(1) –191 –191
Investments at fair value through prot and loss, liquid assets 382 – – 382
Available-for-sale investments, liquid assets carried at fair value 945 11 –956
Available-for-sale investments, cash equivalents carried at fair value 3 957 – – 3 957
Total assets 5 351 220 429 6 000
Other nancial liabilities, derivatives(1) –35 –35
Total liabilities –35 –35
(1) Refer to Note 20, Derivative nancial instruments for the allocation between hedge accounted and non-hedge accounted derivatives.
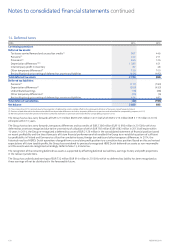
The level 1 category includes nancial assets and liabilities that are measured in whole or in signicant part by reference to published quotes
in an active market. A nancial instrument is regarded as quoted in an active market if quoted prices are readily and regularly available from an
exchange, dealer, broker, industry group, pricing service or regulatory agency and those prices represent actual and regularly occurring market
transactions on an arm’s length basis. This category includes listed bonds and other securities, listed shares and exchange traded derivatives.
The level 2 category includes nancial assets and liabilities measured using a valuation technique based on assumptions that are supported by
prices from observable current market transactions. These include assets and liabilities for which pricing is obtained via pricing services, but
where prices have not been determined in an active market, nancial assets with fair values based on broker quotes and assets that are valued
using the Group’s own valuation models whereby the material assumptions are market observable. The majority of the Group’s
over-the-counter derivatives and certain other instruments not traded in active markets are included in this category.
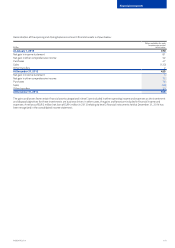
The level 3 category includes nancial assets and liabilities measured using valuation techniques based on non-observable inputs. This means
that fair values are determined in whole or in part using a valuation model based on assumptions that are neither supported by prices from
observable current market transactions in the same instrument nor based on available market data. The fair value measurement objective
remains the same, that is, to estimate an exit price from the perspective of the Group.
The level 3 investments mainly include unlisted equities and unlisted venture funds where the fair value is determined based on relevant
information such as operating performance, recent transactions and available market data on peer companies. No individual input has
asignicant impact on the total fair value.
Notes to consolidated nancial statements continued