Nokia 2014 Annual Report Download - page 194
Download and view the complete annual report
Please find page 194 of the 2014 Nokia annual report below. You can navigate through the pages in the report by either clicking on the pages listed below, or by using the keyword search tool below to find specific information within the annual report.-
 1
1 -
2
-
3
-
4
-
5
-
6
-
7
-
8
-
9
-
10
-
11
-
12
-
13
-
14
-
15
-
16
-
17
-
18
-
19
-
20
-
21
-
22
-
23
-
24
-
25
-
26
-
27
-
28
-
29
-
30
-
31
-
32
-
33
-
34
-
35
-
36
-
37
-
38
-
39
-
40
-
41
-
42
-
43
-
44
-
45
-
46
-
47
-
48
-
49
-
50
-
51
-
52
-
53
-
54
-
55
-
56
-
57
-
58
-
59
-
60
-
61
-
62
-
63
-
64
-
65
-
66
-
67
-
68
-
69
-
70
-
71
-
72
-
73
-
74
-
75
-
76
-
77
-
78
-
79
-
80
-
81
-
82
-
83
-
84
-
85
-
86
-
87
-
88
-
89
-
90
-
91
-
92
-
93
-
94
-
95
-
96
-
97
-
98
-
99
-
100
-
101
-
102
-
103
-
104
-
105
-
106
-
107
-
108
-
109
-
110
-
111
-
112
-
113
-
114
-
115
-
116
-
117
-
118
-
119
-
120
-
121
-
122
-
123
-
124
-
125
-
126
-
127
-
128
-
129
-
130
-
131
-
132
-
133
-
134
-
135
-
136
-
137
-
138
-
139
-
140
-
141
-
142
-
143
-
144
-
145
-
146
-
147
-
148
-
149
-
150
-
151
-
152
-
153
-
154
-
155
-
156
-
157
-
158
-
159
-
160
-
161
-
162
-
163
-
164
-
165
-
166
-
167
-
168
-
169
-
170
-
171
-
172
-
173
-
174
-
175
-
176
-
177
-
178
-
179
-
180
-
181
-
182
-
183
-
 184
184 -
 185
185 -
 186
186 -
 187
187 -
 188
188 -
 189
189 -
 190
190 -
 191
191 -
 192
192 -
 193
193 -
 194
194 -
 195
195 -
 196
196 -
 197
197 -
 198
198 -
 199
199 -
 200
200 -
 201
201 -
 202
202 -
 203
203 -
 204
204 -
205
-
206
-
207
-
208
-
209
-
210
-
211
-
212
-
213
-
214
-
215
-
216
 |
 |

192 NOKIA IN 2014
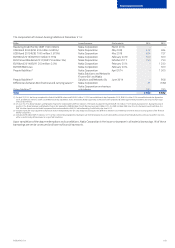
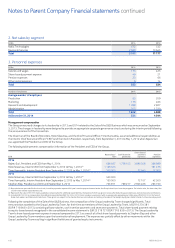
2. Net sales by segment
EURm 2014 2013
Nokia Technologies 572 532
Devices & Services 2 569 10 645
Total 3 141 11 177
3. Personnel expenses
EURm 2014 2013
Salaries and wages 175 423
Share-based payment expense 49 21
Pension expenses 23 66
Other social expenses 6 14
Total 253 524
Number of employees 2014 2013
Average number of employees
Production 63 209
Marketing 176 463
Research and development 1 098 2 827
Administration 505 1 330
Total 1 842 4 829
At December 31, 2014 534 4 544
Management compensation
The Group announced changes to its leadership in 2013 and 2014 related to the Sale of the D&S Business which was announced on September
3, 2013. The changes in leadership were designed to provide an appropriate corporate governance structure during the interim period following
the announcement of the transaction.
The Chairman of the Board of Directors, Risto Siilasmaa, and the Chief Financial Ocer, Timo Ihamuotila, assumed additional responsibilities as
the Interim Chief Executive Ocer (“CEO”) and the Interim President, respectively, from September 3, 2013 to May 1, 2014 when Rajeev Suri
was appointed the President and CEO of the Group.
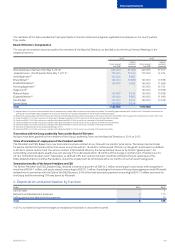
The following table presents compensation information of the President and CEO of the Group.
EUR
Base salary/
fee(1)
Cash incentive
payments
Share-based
payment
expenses
Pension
expenses
2014
Rajeev Suri, President and CEO from May 1, 2014 666 667 1 778 105 3 896 308 366 989
Risto Siilasmaa, Interim CEO from September 3, 2013 to May 1, 2014(2) 1 126 323 191 475
Timo Ihamuotila, Interim President from September 3, 2013 to May 1, 2014(3) 100 000 72 643 17 000
2013
Risto Siilasmaa, Interim CEO from September 3, 2013 to May 1, 2014(2) 500 000
Timo Ihamuotila, Interim President from September 3, 2013 to May 1, 2014(3) 150 000 12 107 42 500
Stephen Elop, President and CEO until September 3, 2013 753 911 769 217 2 903 226 263 730
(1) Base salaries are pro-rated for the time in role. Incentive payments represent full-year incentive payment earned under the Group’s short-term incentive programs. For interim roles, the base salary/fee
is for the role-related responsibilities only.
(2) Represents the value of 200 000 shares awarded as compensation for additional responsibilities, the balance of which was given in shares after deducting associated taxes and social security contributions.
(3) Includes EUR 100 000 as compensation for additional responsibilities (EUR 150 000 in 2013). Also includes an equity grant with an approximate aggregate grant date value of EUR 250 000 in the form of
Nokia stock options and Nokia restricted shares. These grants are subject to the standard terms and conditions and vesting schedules of the Group’s equity plans. Refer to Note 25, Share-based payment.
Following the completion of the Sale of the D&S Business, the composition of the Group Leadership Team changed signicantly. Total
remuneration awarded to the Group Leadership Team, for their time as members of the Group Leadership Team, is EUR 16 234 381
(EUR 9 710 848 in 2013), consisting of base salaries, cash incentive payments and severance payments. Total share-based payment relating
to equity-based awards recognized in the consolidated income statement is EUR 25 519 721 (EUR 7 913 633 in 2013). The Group Leadership
Team’s share-based payment expense increased compared to 2013 as a result of a nal share-based payments to Stephen Elop and other
Group Leadership Team members upon the termination of employment. The expense was partially oset by other movements within the
Group Leadership Team resulting in signicant forfeitures of granted equity instruments.
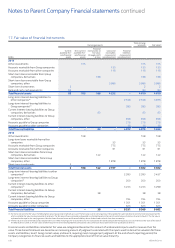
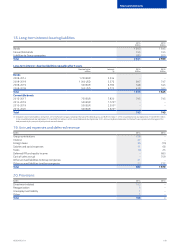
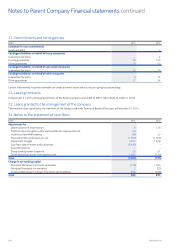
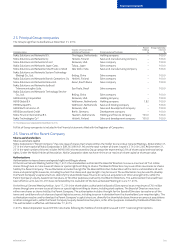
Notes to Parent Company Financial statements continued