Nokia 2014 Annual Report Download - page 147
Download and view the complete annual report
Please find page 147 of the 2014 Nokia annual report below. You can navigate through the pages in the report by either clicking on the pages listed below, or by using the keyword search tool below to find specific information within the annual report.-
 1
1 -
2
-
3
-
4
-
5
-
6
-
7
-
8
-
9
-
10
-
11
-
12
-
13
-
14
-
15
-
16
-
17
-
18
-
19
-
20
-
21
-
22
-
23
-
24
-
25
-
26
-
27
-
28
-
29
-
30
-
31
-
32
-
33
-
34
-
35
-
36
-
37
-
38
-
39
-
40
-
41
-
42
-
43
-
44
-
45
-
46
-
47
-
48
-
49
-
50
-
51
-
52
-
53
-
54
-
55
-
56
-
57
-
58
-
59
-
60
-
61
-
62
-
63
-
64
-
65
-
66
-
67
-
68
-
69
-
70
-
71
-
72
-
73
-
74
-
75
-
76
-
77
-
78
-
79
-
80
-
81
-
82
-
83
-
84
-
85
-
86
-
87
-
88
-
89
-
90
-
91
-
92
-
93
-
94
-
95
-
96
-
97
-
98
-
99
-
100
-
101
-
102
-
103
-
104
-
105
-
106
-
107
-
108
-
109
-
110
-
111
-
112
-
113
-
114
-
115
-
116
-
117
-
118
-
119
-
120
-
121
-
122
-
123
-
124
-
125
-
126
-
127
-
128
-
129
-
130
-
131
-
132
-
133
-
134
-
135
-
136
-
 137
137 -
 138
138 -
 139
139 -
 140
140 -
 141
141 -
 142
142 -
 143
143 -
 144
144 -
 145
145 -
 146
146 -
 147
147 -
 148
148 -
 149
149 -
 150
150 -
 151
151 -
 152
152 -
 153
153 -
 154
154 -
 155
155 -
 156
156 -
 157
157 -
158
-
159
-
160
-
161
-
162
-
163
-
164
-
165
-
166
-
167
-
168
-
169
-
170
-
171
-
172
-
173
-
174
-
175
-
176
-
177
-
178
-
179
-
180
-
181
-
182
-
183
-
184
-
185
-
186
-
187
-
188
-
189
-
190
-
191
-
192
-
193
-
194
-
195
-
196
-
197
-
198
-
199
-
200
-
201
-
202
-
203
-
204
-
205
-
206
-
207
-
208
-
209
-
210
-
211
-
212
-
213
-
214
-
215
-
216
 |
 |
145
Financial statements
NOKIA IN 2014
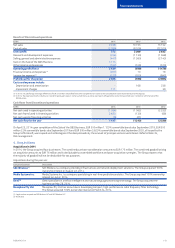
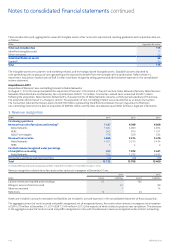
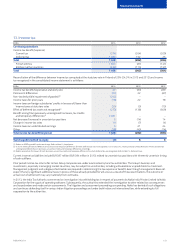
6. Expenses by nature
EURm 2014 2013 2012
Continuing operations
Personnel expenses 3 812 3 857 4 108
Cost of material 3 046 2 835 3 820
Subcontracting costs(1) 2 374 2 799 3 372
Depreciation and amortization 297 560 1 088
Real estate costs 274 351 446
Other(1) 1 418 1 252 2 150
Total 11 221 11 654 14 984
(1) In 2013 and 2012, certain items have been reclassied from other to subcontracting costs to conform with current year presentation.
Rental expenses included in the above line items amount to EUR 193 million (EUR 256 million in 2013 and EUR 361 million in 2012).
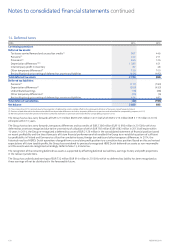
7. Personnel expenses
EURm 2014 2013 2012
Continuing operations
Salaries and wages 3 215 3 432 4 295
Share-based payment expense (Note 25) 65 42 11
Pension expense, net 207 206 232
Other social expenses 366 403 507
Total 3 853 4 083 5 045
Personnel expenses include termination benets. Pension expense, comprising multi-employer, insured and dened contribution plans is EUR
162 million (EUR 160 million in 2013 and EUR 193 million in 2012). Expenses related to dened benet plans comprise the remainder.
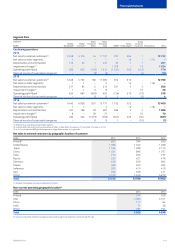
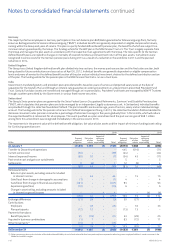
Average number of employees 2014 2013 2012
Continuing operations
Nokia Networks 50 680 52 564 64 052
HERE 6 067 5 897 6 441
Nokia Technologies and Group Common Functions 819 872 1 315
Total 57 566 59 333 71 808
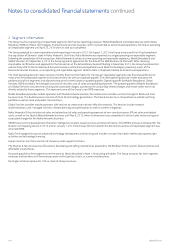
8. Pensions
The Group operates a number of post-employment plans in various countries including both dened contribution and dened benet plans.
These plans expose the Group to actuarial risks such as investment risk, interest rate risk, and life expectancy risk. The characteristics and
associated risks of the dened benet plans vary depending on legal, scal, and economic requirements in each country. These characteristics
and risks are further described below and relate to the plans included in the Continuing operations of the Group.
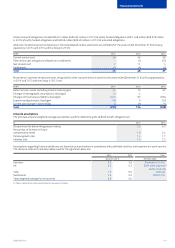
The disclosures for 2014 and 2013 are attributable to the Continuing operations of the Group. Disclosures relating to the 2012 comparative
annual period represent the results of the consolidated Group prior to the Sale of the D&S Business. Accordingly, 2014 and 2013 results are not
directly comparable with 2012.
The total net accrued pension cost of EUR 500 million (EUR 199 million in 2013) consists of an accrual of EUR 530 million included in other
long-term liabilities (EUR 237 million in 2013) and a prepayment of EUR 30 million included in other non-current assets (EUR 38 million in 2013).
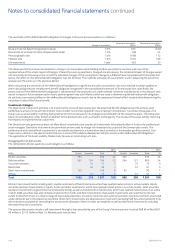
Dened benet plans
The Group’s most signicant dened benet pension plans are in Germany, UK, India and Switzerland. Together they account for 91% (91% in
2013) of the Group’s total dened benet obligation and 92% (92% in 2013) of the Group’s total plan assets.
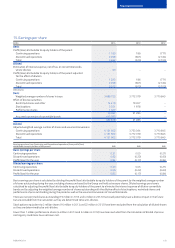
The dened benet obligations, the fair value of plan assets, the eects of the asset ceiling and the net dened benet balance at December 31
for Continuing operations are:
2014 2013 2014 2013 2014 2013 2014 2013
EURm Defined benefit obligation Fair value of plan assets Effects of asset ceiling Net defined benefit balance
Germany (1 381) (1 062) 965 904 (416) (158)
UK (122) (98) 130 108 810
India (117) (85) 112 82 (1) (1) (6) (4)
Switzerland (102) (78) 70 63 (32) (15)
Other (162) (130) 110 104 (2) (6) (54) (32)
Total (1 884) (1 453) 1 387 1 261 (3) (7) (500) (199)