Nokia 2014 Annual Report Download - page 53
Download and view the complete annual report
Please find page 53 of the 2014 Nokia annual report below. You can navigate through the pages in the report by either clicking on the pages listed below, or by using the keyword search tool below to find specific information within the annual report.-
 1
1 -
2
-
3
-
4
-
5
-
6
-
7
-
8
-
9
-
10
-
11
-
12
-
13
-
14
-
15
-
16
-
17
-
18
-
19
-
20
-
21
-
22
-
23
-
24
-
25
-
26
-
27
-
28
-
29
-
30
-
31
-
32
-
33
-
34
-
35
-
36
-
37
-
38
-
39
-
40
-
41
-
42
-
 43
43 -
 44
44 -
 45
45 -
 46
46 -
 47
47 -
 48
48 -
 49
49 -
 50
50 -
 51
51 -
 52
52 -
 53
53 -
 54
54 -
 55
55 -
 56
56 -
 57
57 -
 58
58 -
 59
59 -
 60
60 -
 61
61 -
 62
62 -
 63
63 -
64
-
65
-
66
-
67
-
68
-
69
-
70
-
71
-
72
-
73
-
74
-
75
-
76
-
77
-
78
-
79
-
80
-
81
-
82
-
83
-
84
-
85
-
86
-
87
-
88
-
89
-
90
-
91
-
92
-
93
-
94
-
95
-
96
-
97
-
98
-
99
-
100
-
101
-
102
-
103
-
104
-
105
-
106
-
107
-
108
-
109
-
110
-
111
-
112
-
113
-
114
-
115
-
116
-
117
-
118
-
119
-
120
-
121
-
122
-
123
-
124
-
125
-
126
-
127
-
128
-
129
-
130
-
131
-
132
-
133
-
134
-
135
-
136
-
137
-
138
-
139
-
140
-
141
-
142
-
143
-
144
-
145
-
146
-
147
-
148
-
149
-
150
-
151
-
152
-
153
-
154
-
155
-
156
-
157
-
158
-
159
-
160
-
161
-
162
-
163
-
164
-
165
-
166
-
167
-
168
-
169
-
170
-
171
-
172
-
173
-
174
-
175
-
176
-
177
-
178
-
179
-
180
-
181
-
182
-
183
-
184
-
185
-
186
-
187
-
188
-
189
-
190
-
191
-
192
-
193
-
194
-
195
-
196
-
197
-
198
-
199
-
200
-
201
-
202
-
203
-
204
-
205
-
206
-
207
-
208
-
209
-
210
-
211
-
212
-
213
-
214
-
215
-
216
 |
 |

51
Board review
NOKIA IN 2014
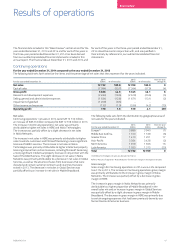
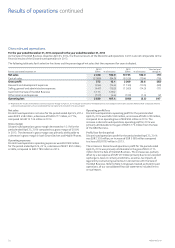
Operating prot/loss
Our 2013 operating prot was EUR 519 million, compared with an
operating loss of EUR 821 million in 2012. The increased operating
prot resulted primarily from lower restructuring charges and
purchase price accounting items in general and an increase in the
operating performance of our Nokia Networks and HERE businesses.
Our operating prot in 2013 included purchase price accounting
items, restructuring charges and other special items of net negative
EUR 917 million compared to net negative EUR 1 963 million in 2012.
Our 2013 operating margin was positive 4.1% compared to negative
5.3% in 2012. The improvement was primarily due to an increase in
our gross margin and lower expenses in other income and expenses.
Net nancial income and expenses
Financial income and expenses, net, was an expense of EUR 280 million
in 2013 compared to an expense of EUR 357 million in 2012.
The lower net expense in 2013 was primarily driven by lower foreign
exchange losses.
Refer to “—Liquidity and capital resources” below.
Prot/loss before taxes
Continuing operations’ prot before tax was EUR 243 million in 2013,
compared to a loss of EUR 1 179 million in 2012. Taxes amounted to
EUR 202 million in 2013 and EUR 304 million in 2012.
Non-controlling interests
Loss attributable to non-controlling interests from Continuing
operations totaled EUR 145 million in 2013, compared with a loss
attributable to non-controlling interests of EUR 712 million in 2012.
This change was primarily due to an improvement in Nokia Networks
results and our acquisition of Siemens’ stake in Nokia Networks.
Prot/loss attributable to equity holders of the parent
and earnings per share
Nokia Group’s total loss attributable to equity holders of the parent
in 2013 amounted to EUR 615 million, compared with a loss of
EUR 3 105 million in 2012. Continuing operations generated a prot
attributable to equity holders of the parent in 2013, amounting to
EUR 186 million, compared with a loss of EUR 771 million in 2012.
Nokia Group’s total earnings per share in 2013 increased to EUR (0.17)
(basic) and EUR (0.17) (diluted), compared with EUR (0.84) (basic) and
EUR (0.84) (diluted) in 2012. From Continuing operations, earnings per
share in 2013 increased to EUR 0.05 (basic) and EUR 0.05 (diluted),
compared with EUR (0.21) (basic) and EUR (0.21) (diluted) in 2012.