Nokia 2014 Annual Report Download - page 30
Download and view the complete annual report
Please find page 30 of the 2014 Nokia annual report below. You can navigate through the pages in the report by either clicking on the pages listed below, or by using the keyword search tool below to find specific information within the annual report.-
 1
1 -
2
-
3
-
4
-
5
-
6
-
7
-
8
-
9
-
10
-
11
-
12
-
13
-
14
-
15
-
16
-
17
-
18
-
19
-
 20
20 -
 21
21 -
 22
22 -
 23
23 -
 24
24 -
 25
25 -
 26
26 -
 27
27 -
 28
28 -
 29
29 -
 30
30 -
 31
31 -
 32
32 -
 33
33 -
 34
34 -
 35
35 -
 36
36 -
 37
37 -
 38
38 -
 39
39 -
 40
40 -
41
-
42
-
43
-
44
-
45
-
46
-
47
-
48
-
49
-
50
-
51
-
52
-
53
-
54
-
55
-
56
-
57
-
58
-
59
-
60
-
61
-
62
-
63
-
64
-
65
-
66
-
67
-
68
-
69
-
70
-
71
-
72
-
73
-
74
-
75
-
76
-
77
-
78
-
79
-
80
-
81
-
82
-
83
-
84
-
85
-
86
-
87
-
88
-
89
-
90
-
91
-
92
-
93
-
94
-
95
-
96
-
97
-
98
-
99
-
100
-
101
-
102
-
103
-
104
-
105
-
106
-
107
-
108
-
109
-
110
-
111
-
112
-
113
-
114
-
115
-
116
-
117
-
118
-
119
-
120
-
121
-
122
-
123
-
124
-
125
-
126
-
127
-
128
-
129
-
130
-
131
-
132
-
133
-
134
-
135
-
136
-
137
-
138
-
139
-
140
-
141
-
142
-
143
-
144
-
145
-
146
-
147
-
148
-
149
-
150
-
151
-
152
-
153
-
154
-
155
-
156
-
157
-
158
-
159
-
160
-
161
-
162
-
163
-
164
-
165
-
166
-
167
-
168
-
169
-
170
-
171
-
172
-
173
-
174
-
175
-
176
-
177
-
178
-
179
-
180
-
181
-
182
-
183
-
184
-
185
-
186
-
187
-
188
-
189
-
190
-
191
-
192
-
193
-
194
-
195
-
196
-
197
-
198
-
199
-
200
-
201
-
202
-
203
-
204
-
205
-
206
-
207
-
208
-
209
-
210
-
211
-
212
-
213
-
214
-
215
-
216
 |
 |

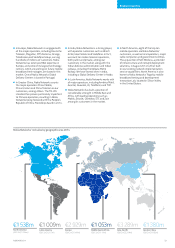
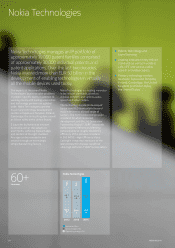
HERE
■More than 25 years of
experience in cartography
■44 countries with live traffic
information
■2.7 million updates to its maps
every day—keeping them fresh,
accurate and reliable
■80 000 sources of data used
to update its map
■Maps for more than
190countries
■Voice guided navigation in
more than 50 languages
4 out of 5
In-car navigation systems in North America
andEurope powered by HERE’s map content
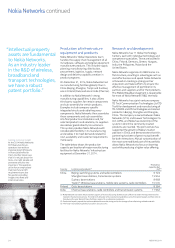
6 257
Employees at December 31, 2014
HERE Global new embedded
navigation licenses
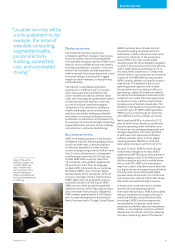
Maps have been abstractions of reality
by necessity: there are limits to how
much information the human mind can
process. But what if maps are made
not just for humans but for machines
capable of comprehending vast
quantities of information?
As computational cartography continues
to advance, maps are taking on new
forms. For HERE, the map is becoming
a dynamic three-dimensional,
highly detailed digital representation
of the world, rich in real-time and
contextually-relevant information drawn
from both real-world and digital sources.
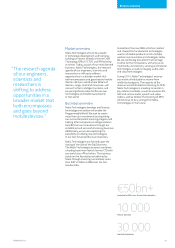
As cartographers, we have long dreamed of creating
the perfect map—one that precisely recreates the
territory it seeks to represent. But, as many in the
eld would tell us, at the heart of that endeavor
liesagreat paradox: the closer to reality a map
becomes,the less useful it tends to be.
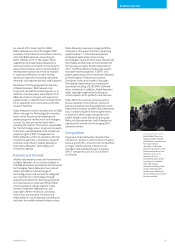
HERE already aggregates data related to
parking, gas prices, trac and weather,
among other things, and we see further
opportunities in a world where billions of
devices, including phones, tablets and
cars, are connected. Accordingly, we are
investing in technologies and analytics
capabilities to ensure HERE’s location
cloud can harness the collective power
of the data these devices generate to
deliver real-time, predictive and relevant
information to every individual user. In
the future, we also intend to leverage
HERE’s location cloud to deliver HD maps
and other services to power an entirely
new class of driver experiences, starting
with highly automated vehicles.
28 NOKIA IN 2014
*Includes a goodwill impairment charge of EUR 1 209 million in 2014.
13
11
8
201220132014
970
914
1 103
(27.3)
79.3 77.2 75.4
(127.9)
(16.8)
201220132014
Units (m) Net sales (€m)
Gross margin (%)
Operating margin (%)*