Nokia 2014 Annual Report Download - page 65
Download and view the complete annual report
Please find page 65 of the 2014 Nokia annual report below. You can navigate through the pages in the report by either clicking on the pages listed below, or by using the keyword search tool below to find specific information within the annual report.-
 1
1 -
2
-
3
-
4
-
5
-
6
-
7
-
8
-
9
-
10
-
11
-
12
-
13
-
14
-
15
-
16
-
17
-
18
-
19
-
20
-
21
-
22
-
23
-
24
-
25
-
26
-
27
-
28
-
29
-
30
-
31
-
32
-
33
-
34
-
35
-
36
-
37
-
38
-
39
-
40
-
41
-
42
-
43
-
44
-
45
-
46
-
47
-
48
-
49
-
50
-
51
-
52
-
53
-
54
-
 55
55 -
 56
56 -
 57
57 -
 58
58 -
 59
59 -
 60
60 -
 61
61 -
 62
62 -
 63
63 -
 64
64 -
 65
65 -
 66
66 -
 67
67 -
 68
68 -
 69
69 -
 70
70 -
 71
71 -
 72
72 -
 73
73 -
 74
74 -
 75
75 -
76
-
77
-
78
-
79
-
80
-
81
-
82
-
83
-
84
-
85
-
86
-
87
-
88
-
89
-
90
-
91
-
92
-
93
-
94
-
95
-
96
-
97
-
98
-
99
-
100
-
101
-
102
-
103
-
104
-
105
-
106
-
107
-
108
-
109
-
110
-
111
-
112
-
113
-
114
-
115
-
116
-
117
-
118
-
119
-
120
-
121
-
122
-
123
-
124
-
125
-
126
-
127
-
128
-
129
-
130
-
131
-
132
-
133
-
134
-
135
-
136
-
137
-
138
-
139
-
140
-
141
-
142
-
143
-
144
-
145
-
146
-
147
-
148
-
149
-
150
-
151
-
152
-
153
-
154
-
155
-
156
-
157
-
158
-
159
-
160
-
161
-
162
-
163
-
164
-
165
-
166
-
167
-
168
-
169
-
170
-
171
-
172
-
173
-
174
-
175
-
176
-
177
-
178
-
179
-
180
-
181
-
182
-
183
-
184
-
185
-
186
-
187
-
188
-
189
-
190
-
191
-
192
-
193
-
194
-
195
-
196
-
197
-
198
-
199
-
200
-
201
-
202
-
203
-
204
-
205
-
206
-
207
-
208
-
209
-
210
-
211
-
212
-
213
-
214
-
215
-
216
 |
 |

63
Board review
NOKIA IN 2014
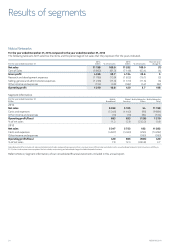
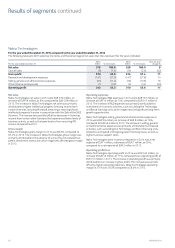
For the year ended December 31, 2013 compared to the year ended December 31, 2012
The following table sets forth selective line items and the percentage of net sales that they represent for years indicated.
For the year ended December 31
2013
EURm % of net sales
2012
EURm % of net sales
Year-on-year
change %
Net sales 529 100.0 534 100.0 (1)
Cost of sales (14) (2.6) (7) (1.3) 100
Gross prot 515 97.4 527 98.7 (2)
Research and development expenses (147) (27.8) (153) (28.7) (4)
Selling and marketing expenses (34) (6.4) (24) (4.5) 42
Administrative and general expenses (22) (4.2) (22) (4.1) –
Other income and expenses (2) (0.4) (3) (0.5) (33)
Operating prot 310 58.6 325 60.9 (5)
Net sales
Nokia Technologies net sales was stable on a year-on-year basis,
EUR 529 million in 2013 compared to EUR 534 million in 2012,
primarily due to a non-recurring license fee of EUR 50 million in the
fourth quarter 2012, partially oset by net increases in royalty
payments from our licensees.
Gross margin
On a year-on-year basis, the Nokia Technologies gross margin
decreased to 97.4% in 2013 compared to 98.7% in 2012.
Operating expenses
Nokia Technologies R&D expenses decreased 4% to EUR 147 million
in 2013 compared to EUR 153 million in 2012, primarily due to
lower R&D costs, partially oset by transaction related costs of
EUR 15 million related to the Sale of the D&S Business.
Nokia Technologies sales and marketing expenses increased 42% to
EUR 34 million in 2013 compared to EUR 24 million in 2012, primarily
due to IPR licensing related litigation expenses. In 2013 sales and
marketing expenses included transaction related costs of EUR 2 million
related to the Sale of the D&S Business.
Nokia Technologies administrative and general expenses were at
year-on-year, amounting to EUR 22 million.
Nokia Technologies other income and expense was approximately at
year-on-year, and included restructuring charges of EUR 2 million in
2013, compared to EUR 3 million in 2012.
Operating prot/loss
Nokia Technologies operating prot decreased to EUR 310 million
in 2013, compared to EUR 325 million in 2012. Nokia Technologies
operating margin in 2013 was 58.6%, compared with 60.9% in 2012.
The year-on-year decline in operating margin was driven primarily by
the transaction related costs of EUR 17 million related to the Sale of
the D&S Business, partially oset by decreased restructuring charges.
Group Common Functions
For the year ended December 31, 2014 compared to the year ended
December 31, 2013
Group Common Functions operating loss in 2014 was EUR 142 million,
an increase of EUR 85 million, or 149%, compared to an operating loss
of EUR 57 million in 2013. The increase in operating loss was primarily
attributable to the absence of a distribution from an unlisted venture
fund related to the disposal of the fund’s investment in Waze Ltd of
EUR 59 million that benetted Group Common Functions in 2013. In
2014, Group Common Functions included transaction related costs of
EUR 21 million related to the Sale of the D&S Business. In 2013, Group
Common Functions included restructuring charges and associated
impairments of EUR 10 million, as well as transaction related costs of
EUR 18 million related to the Sale of the D&S Business.
For the year ended December 31, 2013 compared to the year ended
December 31, 2012
Group Common Functions operating loss totaled EUR 57 million in
2013, compared to EUR 50 million in 2012. In 2013, Group Common
Functions included restructuring charges and associated impairments
of EUR 10 million, as well as transaction related costs of EUR 18 million
related to the Sale of the D&S Business. In 2013, the Group Common
Functions benetted from a distribution from an unlisted venture
fund related to the disposal of the fund’s investment in Waze Ltd of
EUR 59 million. In 2012, Group Common Functions benetted from
a net gain from sale of real estate of EUR 79 million and included
restructuring charges of EUR 6 million.