Nokia 2014 Annual Report Download - page 143
Download and view the complete annual report
Please find page 143 of the 2014 Nokia annual report below. You can navigate through the pages in the report by either clicking on the pages listed below, or by using the keyword search tool below to find specific information within the annual report.-
 1
1 -
2
-
3
-
4
-
5
-
6
-
7
-
8
-
9
-
10
-
11
-
12
-
13
-
14
-
15
-
16
-
17
-
18
-
19
-
20
-
21
-
22
-
23
-
24
-
25
-
26
-
27
-
28
-
29
-
30
-
31
-
32
-
33
-
34
-
35
-
36
-
37
-
38
-
39
-
40
-
41
-
42
-
43
-
44
-
45
-
46
-
47
-
48
-
49
-
50
-
51
-
52
-
53
-
54
-
55
-
56
-
57
-
58
-
59
-
60
-
61
-
62
-
63
-
64
-
65
-
66
-
67
-
68
-
69
-
70
-
71
-
72
-
73
-
74
-
75
-
76
-
77
-
78
-
79
-
80
-
81
-
82
-
83
-
84
-
85
-
86
-
87
-
88
-
89
-
90
-
91
-
92
-
93
-
94
-
95
-
96
-
97
-
98
-
99
-
100
-
101
-
102
-
103
-
104
-
105
-
106
-
107
-
108
-
109
-
110
-
111
-
112
-
113
-
114
-
115
-
116
-
117
-
118
-
119
-
120
-
121
-
122
-
123
-
124
-
125
-
126
-
127
-
128
-
129
-
130
-
131
-
132
-
 133
133 -
 134
134 -
 135
135 -
 136
136 -
 137
137 -
 138
138 -
 139
139 -
 140
140 -
 141
141 -
 142
142 -
 143
143 -
 144
144 -
 145
145 -
 146
146 -
 147
147 -
 148
148 -
 149
149 -
 150
150 -
 151
151 -
 152
152 -
 153
153 -
154
-
155
-
156
-
157
-
158
-
159
-
160
-
161
-
162
-
163
-
164
-
165
-
166
-
167
-
168
-
169
-
170
-
171
-
172
-
173
-
174
-
175
-
176
-
177
-
178
-
179
-
180
-
181
-
182
-
183
-
184
-
185
-
186
-
187
-
188
-
189
-
190
-
191
-
192
-
193
-
194
-
195
-
196
-
197
-
198
-
199
-
200
-
201
-
202
-
203
-
204
-
205
-
206
-
207
-
208
-
209
-
210
-
211
-
212
-
213
-
214
-
215
-
216
 |
 |

141
Financial statements
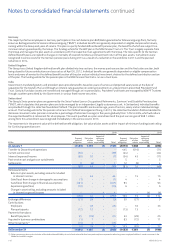
NOKIA IN 2014
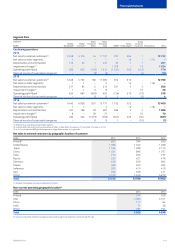
Segment data
Segment
EURm
Mobile
Broadband(1)
Global
Services(1)
Nokia
Networks
Other
Nokia
Networks
Total HERE(1)
Nokia
Technologies(1)
Group
Common
Functions Eliminations Total
Continuing operations
2014
Net sales to external customers(2) 6 038 5 105 54 11 197 970 564 112 732
Net sales to other segments 1 – – 1 – 14 –(15) –
Depreciation and amortization 179 52 1232 57 1 7 297
Impairment charges(3) – – – – 1 209 –15 1 224
Operating prot/(loss) 683 653 (126) 1 210 (1 241) 343 (142) 170
Share of results of associated companies – – (9) (9) – – (3) (12)
2013
Net sales to external customers(2) 5 346 5 752 182 11 280 914 515 –12 709
Net sales to other segments 1 1 – 2 – 14 –(16) –
Depreciation and amortization 217 94 2313 241 3 3 560
Impairment charges(3) 1 1 6 8 – – 12 20
Operating prot/(loss) 420 693 (693) 420 (154) 310 (57) 519
Share of results of associated companies – – 8 8 1 – (5) 4
2012
Net sales to external customers(2) 6 042 6 928 807 13 777 1 103 520 –15 400
Net sales to other segments 1 1 – 2 – 14 –(16) –
Depreciation and amortization 351 198 38 587 496 3 2 1 088
Impairment charges(3) 8 – 29 37 – – 33 70
Operating prot/(loss) 490 334 (1 619) (795) (301) 325 (50) (821)
Share of results of associated companies – – 8 8 1 – (10) (1)
(1) Represents an operating and reportable segment.
(2) Includes HERE sales to Discontinued operations of EUR 31 million (EUR 154 million in 2013 and EUR 374 million in 2012).
(3) In 2014, includes the HERE goodwill impairment charge. Refer to Note 10, Impairment.
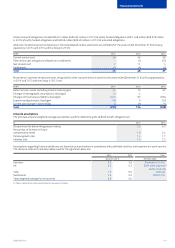
Net sales to external customers by geographic location of customer
EURm 2014 2013 2012
Finland(1) 697 594 659
United States 1 789 1 542 1 498
Japan 1 194 1 388 2 176
China 1 021 896 1 077
India 772 656 757
Russia 550 421 476
Germany 446 609 844
Taiwan 389 305 265
Indonesia 385 410 418
Italy 369 339 411
Other 5 120 5 549 6 819
Total 12 732 12 709 15 400
(1) All Nokia Technologies net sales are allocated to Finland.
Non-current assets by geographic location(1)
EURm 2014 2013
Finland 574 529
USA 2 686 3 371
China 117 94
India 71 58
Other 181 194
Total 3 629 4 246
(1) Consists of goodwill and other intangible assets, property, plant and equipment, and assets held for sale.