Nokia 2014 Annual Report Download - page 154
Download and view the complete annual report
Please find page 154 of the 2014 Nokia annual report below. You can navigate through the pages in the report by either clicking on the pages listed below, or by using the keyword search tool below to find specific information within the annual report.-
 1
1 -
2
-
3
-
4
-
5
-
6
-
7
-
8
-
9
-
10
-
11
-
12
-
13
-
14
-
15
-
16
-
17
-
18
-
19
-
20
-
21
-
22
-
23
-
24
-
25
-
26
-
27
-
28
-
29
-
30
-
31
-
32
-
33
-
34
-
35
-
36
-
37
-
38
-
39
-
40
-
41
-
42
-
43
-
44
-
45
-
46
-
47
-
48
-
49
-
50
-
51
-
52
-
53
-
54
-
55
-
56
-
57
-
58
-
59
-
60
-
61
-
62
-
63
-
64
-
65
-
66
-
67
-
68
-
69
-
70
-
71
-
72
-
73
-
74
-
75
-
76
-
77
-
78
-
79
-
80
-
81
-
82
-
83
-
84
-
85
-
86
-
87
-
88
-
89
-
90
-
91
-
92
-
93
-
94
-
95
-
96
-
97
-
98
-
99
-
100
-
101
-
102
-
103
-
104
-
105
-
106
-
107
-
108
-
109
-
110
-
111
-
112
-
113
-
114
-
115
-
116
-
117
-
118
-
119
-
120
-
121
-
122
-
123
-
124
-
125
-
126
-
127
-
128
-
129
-
130
-
131
-
132
-
133
-
134
-
135
-
136
-
137
-
138
-
139
-
140
-
141
-
142
-
143
-
 144
144 -
 145
145 -
 146
146 -
 147
147 -
 148
148 -
 149
149 -
 150
150 -
 151
151 -
 152
152 -
 153
153 -
 154
154 -
 155
155 -
 156
156 -
 157
157 -
 158
158 -
 159
159 -
 160
160 -
 161
161 -
 162
162 -
 163
163 -
 164
164 -
165
-
166
-
167
-
168
-
169
-
170
-
171
-
172
-
173
-
174
-
175
-
176
-
177
-
178
-
179
-
180
-
181
-
182
-
183
-
184
-
185
-
186
-
187
-
188
-
189
-
190
-
191
-
192
-
193
-
194
-
195
-
196
-
197
-
198
-
199
-
200
-
201
-
202
-
203
-
204
-
205
-
206
-
207
-
208
-
209
-
210
-
211
-
212
-
213
-
214
-
215
-
216
 |
 |

152 NOKIA IN 2014
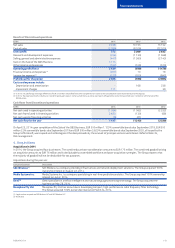
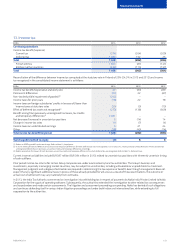
12. Financial income and expenses
EURm 2014 2013 2012
Continuing operations
Interest income on investments and loans receivable(1) 50 108 130
Net interest expense on derivatives not under hedge accounting (4) (4) (4)
Interest expense on nancial liabilities carried at amortized cost(2) (387) (319) (263)
Net realized gains/(losses) on disposal of xed income available-for-sale nancial investments 12(1)
Net fair value gains/(losses) on investments at fair value through prot and loss 20 (29) 27
Net (losses)/gains on other derivatives designated at fair value through prot and loss (20) 32 (11)
Net fair value (losses)/gains on hedged items under fair value hedge accounting (18) 69 (15)
Net fair value gains/(losses) on hedging instruments under fair value hedge accounting 17 (63) 23
Net foreign exchange gains/(losses)(3):
From foreign exchange derivatives designated at fair value through prot and loss 162 (28) (42)
From the revaluation of statement of nancial position (216) (74) (223)
Other nancial income(4) 15 49 54
Other nancial expenses(5) (15) (23) (32)
Total (395) (280) (357)
(1) In 2014, the decrease is mainly a result of lower cash and other liquid assets compared with 2013 as well as a continuing decline in interest rates. In 2013, interest income decreased mainly as a result
of lower cash and other liquid assets compared with 2012 and lower interest rates in certain currencies where the Group has investments.
(2) In 2014, the increase is due to a one-time non-cash charge of EUR 57 million relating to the repayment of the EUR 1.5 billion convertible bonds issued to Microsoft when the Sale of the D&S Business
was completed and one-time expenses of EUR 123 million relating to the redemption of materially all Nokia Networks borrowings. In 2013, interest expense increased compared with 2012 due to
higher levels of borrowings as well as expenses related to funding the purchase of Nokia Networks’ non-controlling interest from Siemens.
(3) Positively impacted by a reduction in hedging costs. In 2013, positively impacted by lower hedging costs compared with 2012 as well as lower volatility of certain emerging market currencies.
(4) Includes distributions of EUR 14 million (EUR 44 million in 2013 and EUR 49 million in 2012) from private funds held as non-current available-for-sale investments.
(5) Includes an impairment charge of EUR 2 million (nil in 2013 and EUR 7 million in 2012) in private funds held as non-current available-for-sale investments due to changes in estimated future cash ows
resulting from distributions received as well as other factors. Refer to Note 11, Other income and expenses, and Note 10, Impairment.
Notes to consolidated nancial statements continued