Nokia 2014 Annual Report Download - page 160
Download and view the complete annual report
Please find page 160 of the 2014 Nokia annual report below. You can navigate through the pages in the report by either clicking on the pages listed below, or by using the keyword search tool below to find specific information within the annual report.-
 1
1 -
2
-
3
-
4
-
5
-
6
-
7
-
8
-
9
-
10
-
11
-
12
-
13
-
14
-
15
-
16
-
17
-
18
-
19
-
20
-
21
-
22
-
23
-
24
-
25
-
26
-
27
-
28
-
29
-
30
-
31
-
32
-
33
-
34
-
35
-
36
-
37
-
38
-
39
-
40
-
41
-
42
-
43
-
44
-
45
-
46
-
47
-
48
-
49
-
50
-
51
-
52
-
53
-
54
-
55
-
56
-
57
-
58
-
59
-
60
-
61
-
62
-
63
-
64
-
65
-
66
-
67
-
68
-
69
-
70
-
71
-
72
-
73
-
74
-
75
-
76
-
77
-
78
-
79
-
80
-
81
-
82
-
83
-
84
-
85
-
86
-
87
-
88
-
89
-
90
-
91
-
92
-
93
-
94
-
95
-
96
-
97
-
98
-
99
-
100
-
101
-
102
-
103
-
104
-
105
-
106
-
107
-
108
-
109
-
110
-
111
-
112
-
113
-
114
-
115
-
116
-
117
-
118
-
119
-
120
-
121
-
122
-
123
-
124
-
125
-
126
-
127
-
128
-
129
-
130
-
131
-
132
-
133
-
134
-
135
-
136
-
137
-
138
-
139
-
140
-
141
-
142
-
143
-
144
-
145
-
146
-
147
-
148
-
149
-
 150
150 -
 151
151 -
 152
152 -
 153
153 -
 154
154 -
 155
155 -
 156
156 -
 157
157 -
 158
158 -
 159
159 -
 160
160 -
 161
161 -
 162
162 -
 163
163 -
 164
164 -
 165
165 -
 166
166 -
 167
167 -
 168
168 -
 169
169 -
 170
170 -
171
-
172
-
173
-
174
-
175
-
176
-
177
-
178
-
179
-
180
-
181
-
182
-
183
-
184
-
185
-
186
-
187
-
188
-
189
-
190
-
191
-
192
-
193
-
194
-
195
-
196
-
197
-
198
-
199
-
200
-
201
-
202
-
203
-
204
-
205
-
206
-
207
-
208
-
209
-
210
-
211
-
212
-
213
-
214
-
215
-
216
 |
 |

158 NOKIA IN 2014
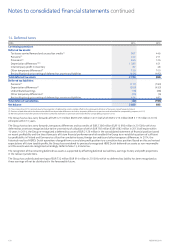
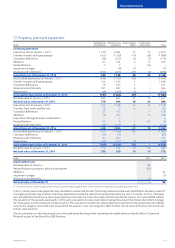
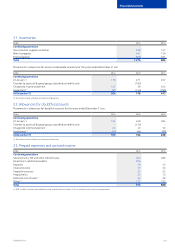
18. Investments in associated companies
EURm 2014 2013
Continuing operations
Net carrying amount at January 1 65 58
Translation dierences 5(1)
Additions –9
Deductions (7) –
Share of results (12) 4
Dividend –(5)
Net carrying amount at December 31 51 65
Shareholdings in associated companies comprise investments in unlisted companies.
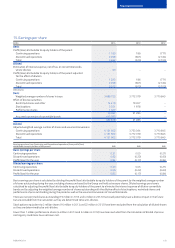
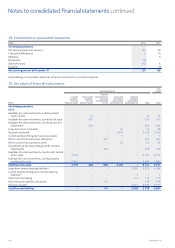
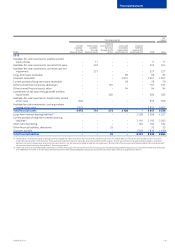
19. Fair value of nancial instruments
EURm
Carrying amounts
Fair
value(1)
Current
available-
for-sale
financial assets
Non-current
available-
for-sale
financial assets
Financial
instruments at
fair value
through profit
or loss
Loans and
receivables
measured at
amortized cost
Financial
liabilities
measured at
amortized cost Total Total
Continuing operations
2014
Available-for-sale investments, publicly quoted
equity shares –14 – – – 14 14
Available-for-sale investments, carried at fair value –570 – – – 570 570
Available-for-sale investments, carried at cost less
impairment –244 –––244 244
Long-term loans receivable – – – 34 –34 28
Accounts receivable – – – 3 430 –3 430 3 430
Current portion of long-term loans receivable – – – 1 – 1 1
Other current nancial assets, derivatives – – 241 – – 241 241
Other current nancial assets, other –––25 –25 25
Investments at fair value through prot and loss,
liquid assets – – 418 – – 418 418
Available-for-sale investments, liquid assets carried
at fair value 2 127 – – – – 2 127 2 127
Available for-sale investments, cash equivalents
carried at fair value 2 643 – – – – 2 643 2 643
Total nancial assets 4 770 828 659 3 490 –9 747 9 741
Long-term interest-bearing liabilities(2) – – – – 2 576 2 576 4 058
Current portion of long-term interest-bearing
liabilities(2) – – – – 1 1 1
Short-term borrowing – – – – 115 115 115
Other nancial liabilities, derivatives – – 174 – – 174 174
Accounts payable – – – – 2 313 2 313 2 313
Total nancial liabilities – – 174 –5 005 5 179 6 661
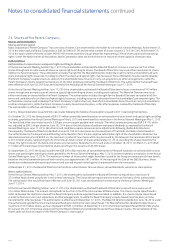
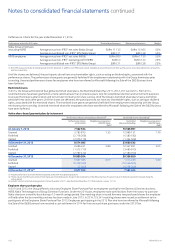
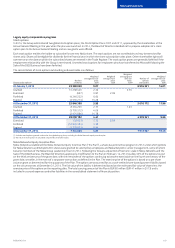
Notes to consolidated nancial statements continued