Nokia 2014 Annual Report Download - page 58
Download and view the complete annual report
Please find page 58 of the 2014 Nokia annual report below. You can navigate through the pages in the report by either clicking on the pages listed below, or by using the keyword search tool below to find specific information within the annual report.-
 1
1 -
2
-
3
-
4
-
5
-
6
-
7
-
8
-
9
-
10
-
11
-
12
-
13
-
14
-
15
-
16
-
17
-
18
-
19
-
20
-
21
-
22
-
23
-
24
-
25
-
26
-
27
-
28
-
29
-
30
-
31
-
32
-
33
-
34
-
35
-
36
-
37
-
38
-
39
-
40
-
41
-
42
-
43
-
44
-
45
-
46
-
47
-
 48
48 -
 49
49 -
 50
50 -
 51
51 -
 52
52 -
 53
53 -
 54
54 -
 55
55 -
 56
56 -
 57
57 -
 58
58 -
 59
59 -
 60
60 -
 61
61 -
 62
62 -
 63
63 -
 64
64 -
 65
65 -
 66
66 -
 67
67 -
 68
68 -
69
-
70
-
71
-
72
-
73
-
74
-
75
-
76
-
77
-
78
-
79
-
80
-
81
-
82
-
83
-
84
-
85
-
86
-
87
-
88
-
89
-
90
-
91
-
92
-
93
-
94
-
95
-
96
-
97
-
98
-
99
-
100
-
101
-
102
-
103
-
104
-
105
-
106
-
107
-
108
-
109
-
110
-
111
-
112
-
113
-
114
-
115
-
116
-
117
-
118
-
119
-
120
-
121
-
122
-
123
-
124
-
125
-
126
-
127
-
128
-
129
-
130
-
131
-
132
-
133
-
134
-
135
-
136
-
137
-
138
-
139
-
140
-
141
-
142
-
143
-
144
-
145
-
146
-
147
-
148
-
149
-
150
-
151
-
152
-
153
-
154
-
155
-
156
-
157
-
158
-
159
-
160
-
161
-
162
-
163
-
164
-
165
-
166
-
167
-
168
-
169
-
170
-
171
-
172
-
173
-
174
-
175
-
176
-
177
-
178
-
179
-
180
-
181
-
182
-
183
-
184
-
185
-
186
-
187
-
188
-
189
-
190
-
191
-
192
-
193
-
194
-
195
-
196
-
197
-
198
-
199
-
200
-
201
-
202
-
203
-
204
-
205
-
206
-
207
-
208
-
209
-
210
-
211
-
212
-
213
-
214
-
215
-
216
 |
 |

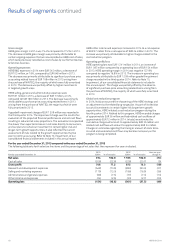
56 NOKIA IN 2014
Results of segments continued
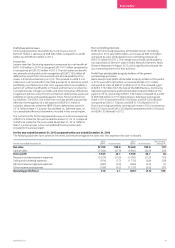
Operating prot/loss
Nokia Networks operating prot was EUR 1 210 million in 2014,
an increase of EUR 790 million compared to an operating prot of
EUR 420 million in 2013. Nokia Networks operating margin in 2014
was10.8% compared to 3.7% in 2013. The increase in operating
protwas primarily attributable to an increase in operating prot
inMobile Broadband. The increase was partially oset by a decrease
inoperating prot in Global Services.
Mobile Broadband operating prot increased from EUR 420 million
in 2013 to EUR 683 million in 2014. The increase in operating prot
was attributable to higher gross prot.
Global Services operating prot decreased from EUR 693 million in
2013 to EUR 653 million in 2014. The decrease in operating prot
was primarily attributable to lower gross prot. The decrease was
partially oset by lower operating expenses.
Strategy and restructuring program
In November 2011, Nokia Networks announced its strategy to focus
onmobile broadband and related services, and also launched an
extensive global restructuring program, targeting a reduction of its
annualized operating expenses and production overhead, excluding
special items and purchase price accounting related items, by
EUR 1 billion by the end of 2013, compared to the end of 2011.
In January 2013, this target was raised to EUR 1.5 billion, and in July
2013 this target was further raised to “more than EUR 1.5 billion”.
While these savings were expected to come largely from organizational
streamlining, the program also targeted areas such as real estate,
information technology, product and service procurement costs,
overall general and administrative expenses, and a signicant
reduction of suppliers in order to further lower costs and improve
quality. In 2013, Nokia Networks achieved its target to reduce
operating expenses and production overhead, excluding special items
and purchase price accounting items, by more than EUR 1.5 billion
by the end of 2013, compared to the end of 2011.
In 2014, Nokia Networks recognized restructuring and associated
charges of EUR 57 million related to this restructuring program,
resulting in cumulative charges of approximately EUR 1 900 million.
By the end of 2014, Nokia Networks had cumulative restructuring
related cash outows of approximately EUR 1 550 million relating to
this restructuring program. Nokia Networks expects the remaining
restructuring related cash outows relating to this restructuring
program to be approximately EUR 200 million, the majority of
which will be paid over the next two years.
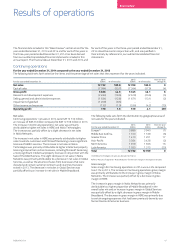
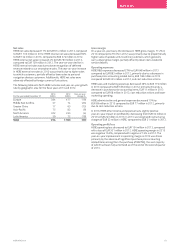
For the year ended December 31, 2013 compared to the year ended December 31, 2012
The following table sets forth selective line items and the percentage of net sales that they represent for years indicated.
For the year ended December 31
2013
EURm % of net sales
2012
EURm % of net sales
Year-on-year
change %
Net sales 11 282 100.0 13 779 100.0 (18)
Cost of sales (7 148) (63.4) (9 610) (69.7) (26)
Gross prot 4 134 36.6 4 169 30.3 (1)
Research and development expenses (1 822) (16.1) (2 046) (14.8) (11)
Selling and marketing expenses (821) (7.3) (1 158) (8.4) (29)
Administrative and general expenses (489) (4.3) (470) (3.4) 4
Other income and expenses (582) (5.2) (1 290) (9.4) (55)
Operating prot/(loss) 420 3.7 (795) (5.8) 153