Nokia 2014 Annual Report Download - page 117
Download and view the complete annual report
Please find page 117 of the 2014 Nokia annual report below. You can navigate through the pages in the report by either clicking on the pages listed below, or by using the keyword search tool below to find specific information within the annual report.-
 1
1 -
 2
2 -
 3
3 -
 4
4 -
 5
5 -
 6
6 -
 7
7 -
 8
8 -
 9
9 -
 10
10 -
 11
11 -
 12
12 -
 13
13 -
 14
14 -
 15
15 -
 16
16 -
 17
17 -
 18
18 -
 19
19 -
 20
20 -
 21
21 -
 22
22 -
 23
23 -
 24
24 -
 25
25 -
 26
26 -
 27
27 -
 28
28 -
 29
29 -
 30
30 -
 31
31 -
 32
32 -
 33
33 -
 34
34 -
 35
35 -
 36
36 -
 37
37 -
 38
38 -
 39
39 -
 40
40 -
 41
41 -
 42
42 -
 43
43 -
 44
44 -
 45
45 -
 46
46 -
 47
47 -
 48
48 -
 49
49 -
 50
50 -
 51
51 -
 52
52 -
 53
53 -
 54
54 -
 55
55 -
 56
56 -
 57
57 -
 58
58 -
 59
59 -
 60
60 -
 61
61 -
 62
62 -
 63
63 -
 64
64 -
 65
65 -
 66
66 -
 67
67 -
 68
68 -
 69
69 -
 70
70 -
 71
71 -
 72
72 -
 73
73 -
 74
74 -
 75
75 -
 76
76 -
 77
77 -
 78
78 -
 79
79 -
 80
80 -
 81
81 -
 82
82 -
 83
83 -
 84
84 -
 85
85 -
 86
86 -
 87
87 -
 88
88 -
 89
89 -
 90
90 -
 91
91 -
 92
92 -
 93
93 -
 94
94 -
 95
95 -
 96
96 -
 97
97 -
 98
98 -
 99
99 -
 100
100 -
 101
101 -
 102
102 -
 103
103 -
 104
104 -
 105
105 -
 106
106 -
 107
107 -
 108
108 -
 109
109 -
 110
110 -
 111
111 -
 112
112 -
 113
113 -
 114
114 -
 115
115 -
 116
116 -
 117
117 -
 118
118 -
 119
119 -
 120
120 -
 121
121 -
 122
122 -
 123
123 -
 124
124 -
 125
125 -
 126
126 -
 127
127 -
 128
128 -
 129
129 -
 130
130 -
 131
131 -
 132
132 -
 133
133 -
 134
134 -
 135
135 -
 136
136 -
 137
137 -
 138
138 -
 139
139 -
 140
140 -
 141
141 -
 142
142 -
 143
143 -
 144
144 -
 145
145 -
 146
146 -
 147
147 -
 148
148 -
 149
149 -
 150
150 -
 151
151 -
 152
152 -
 153
153 -
 154
154 -
 155
155 -
 156
156 -
 157
157 -
 158
158 -
 159
159 -
 160
160 -
 161
161 -
 162
162 -
 163
163 -
 164
164 -
 165
165 -
 166
166 -
 167
167 -
 168
168 -
 169
169 -
 170
170 -
 171
171 -
 172
172 -
 173
173 -
 174
174 -
 175
175 -
 176
176 -
 177
177 -
 178
178 -
 179
179 -
 180
180 -
 181
181 -
 182
182 -
 183
183 -
 184
184 -
 185
185 -
 186
186 -
 187
187 -
 188
188 -
 189
189 -
 190
190 -
 191
191 -
 192
192 -
 193
193 -
 194
194 -
 195
195 -
 196
196 -
 197
197 -
 198
198 -
 199
199 -
 200
200 -
 201
201 -
 202
202 -
 203
203 -
 204
204 -
 205
205 -
 206
206 -
 207
207 -
 208
208 -
 209
209 -
 210
210 -
 211
211 -
 212
212 -
 213
213 -
 214
214 -
 215
215 -
 216
216
 |
 |

115
General facts
NOKIA IN 2014
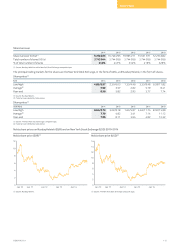
Share turnover
2014 2013 2012 2011 2010
Share turnover (000s)(1) 9 278 853 16 748 295 19 995 211 15 651 671 12 273 862
Total number of shares (000s) 3 745 044 3 744 956 3 744 956 3 744 956 3 744 956
% of total number of shares 248% 447% 534% 418% 328%
(1) Source: Nasdaq Helsinki and the New York Stock Exchange composite tape.
The principal trading markets for the shares are the New York Stock Exchange, in the form of ADSs, and Nasdaq Helsinki, in the form of shares.
Share prices(1)
EUR 2014 2013 2012 2011 2010
Low/high 4.89/6.97 2.30/6.03 1.33/4.46 3.33/8.48 6.58/11.82
Average(2) 5.99 3.57 2.62 5.19 8.41
Year-end 6.56 5.82 2.93 3.77 7.74
(1) Source: Nasdaq Helsinki.
(2) Total turnover divided by total volume.
Share prices(1)
USD (ADS) 2014 2013 2012 2011 2010
Low/high 6.64/8.73 3.02/8.18 1.63/5.87 4.46/11.75 8.00/15.89
Average(2) 7.79 4.82 3.41 7.14 11.12
Year-end 7.86 8.11 3.95 4.82 10.32
(1) Source: The New York Stock Exchange composite tape.
(2) Total turnover divided by total volume.
Nokia share prices on Nasdaq Helsinki (EUR) and on New York Stock Exchange (USD) 2010-2014
Nokia share price (EUR)(1)
09
11
10
12
13
0
2
4
6
8
10
12
Jan 10 Jan 11 Jan 12 Jan 13 Jan 14
(1) Source: Nasdaq Helsinki.
Nokia share price (USD)(1)
09
11
10
12
13
0
2
4
6
8
10
12
14
16
Jan 10 Jan 11 Jan 12 Jan 13 Jan 14
(1) Source: The New York Stock Exchange composite tape.
