Nokia 2014 Annual Report Download - page 57
Download and view the complete annual report
Please find page 57 of the 2014 Nokia annual report below. You can navigate through the pages in the report by either clicking on the pages listed below, or by using the keyword search tool below to find specific information within the annual report.-
 1
1 -
2
-
3
-
4
-
5
-
6
-
7
-
8
-
9
-
10
-
11
-
12
-
13
-
14
-
15
-
16
-
17
-
18
-
19
-
20
-
21
-
22
-
23
-
24
-
25
-
26
-
27
-
28
-
29
-
30
-
31
-
32
-
33
-
34
-
35
-
36
-
37
-
38
-
39
-
40
-
41
-
42
-
43
-
44
-
45
-
46
-
 47
47 -
 48
48 -
 49
49 -
 50
50 -
 51
51 -
 52
52 -
 53
53 -
 54
54 -
 55
55 -
 56
56 -
 57
57 -
 58
58 -
 59
59 -
 60
60 -
 61
61 -
 62
62 -
 63
63 -
 64
64 -
 65
65 -
 66
66 -
 67
67 -
68
-
69
-
70
-
71
-
72
-
73
-
74
-
75
-
76
-
77
-
78
-
79
-
80
-
81
-
82
-
83
-
84
-
85
-
86
-
87
-
88
-
89
-
90
-
91
-
92
-
93
-
94
-
95
-
96
-
97
-
98
-
99
-
100
-
101
-
102
-
103
-
104
-
105
-
106
-
107
-
108
-
109
-
110
-
111
-
112
-
113
-
114
-
115
-
116
-
117
-
118
-
119
-
120
-
121
-
122
-
123
-
124
-
125
-
126
-
127
-
128
-
129
-
130
-
131
-
132
-
133
-
134
-
135
-
136
-
137
-
138
-
139
-
140
-
141
-
142
-
143
-
144
-
145
-
146
-
147
-
148
-
149
-
150
-
151
-
152
-
153
-
154
-
155
-
156
-
157
-
158
-
159
-
160
-
161
-
162
-
163
-
164
-
165
-
166
-
167
-
168
-
169
-
170
-
171
-
172
-
173
-
174
-
175
-
176
-
177
-
178
-
179
-
180
-
181
-
182
-
183
-
184
-
185
-
186
-
187
-
188
-
189
-
190
-
191
-
192
-
193
-
194
-
195
-
196
-
197
-
198
-
199
-
200
-
201
-
202
-
203
-
204
-
205
-
206
-
207
-
208
-
209
-
210
-
211
-
212
-
213
-
214
-
215
-
216
 |
 |

55
Board review
NOKIA IN 2014
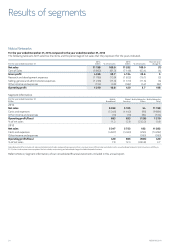
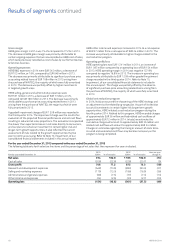
Net sales
Nokia Networks’ net sales in 2014 were EUR 11 198 million, a decrease
of EUR 84 million, or 1%, compared to EUR 11 282 million in 2013.
The decrease in Nokia Networks net sales was primarily attributable to
a decrease in Global Services net sales, and the absence of sales from
businesses that were divested and certain customer contracts and
countries that were exited in 2013. The decrease was partly oset by
an increase in Mobile Broadband net sales.
Mobile Broadband net sales increased to EUR 6 039 million in 2014,
or13% compared to EUR 5 347 million in 2013. The increase was
primarily attributable to an increase in net sales in radio and core
networking technologies. The increase in radio technologies net sales
was primarily attributable to growth in LTE. The increase was partially
oset by a decrease in net sales in mature radio technologies.
Global Services net sales decreased to EUR 5 105 million in 2014,
or11%, compared to EUR 5 753 million in 2013. The decrease
was primarily attributable to decreases in net sales in network
implementation, managed services including the exiting of certain
customer contracts and countries, as well as a decrease in the care
business line. The decrease was partially oset by an increase in net
sales in the systems integration business line.
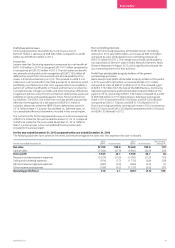
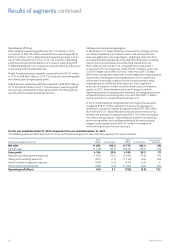
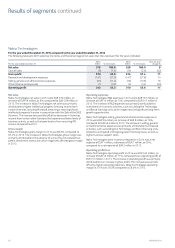
The following table sets forth the distribution by geographical area
of our net sales for the years indicated.
For the year ended December 31
2014
EURm
2013
EURm
Year-on-year
change %
Europe 2 929 3 041 (4)
Middle East & Africa 1 053 1 111 (5)
Greater China 1 380 1 185 16
Asia-Pacic 3 289 3 354 (2)
North America 1 538 1 334 15
Latin America 1 009 1 257 (20)
Total 11 198 11 282 (1)
Nokia Networks net sales in Latin America decreased 20% in 2014
compared to 2013 primarily due to the exiting of certain customer
contracts and lower network deployments in Brazil, Chile and Mexico.
In Europe, net sales decreased 4% primarily due to lower network
deployments in Western Europe, partially oset by higher network
deployments in Eastern Europe. In Asia-Pacic, net sales decreased
2% primarily due to lower network deployments in Japan, partially
oset by higher network deployments in India and Korea. In the
Middle East and Africa, net sales decreased 5% primarily due to lower
network deployments. In Greater China, net sales increased 16%
primarily due to higher LTE network deployments. In North America,
net sales increased 15% primarily due to LTE network deployments
at major customers.
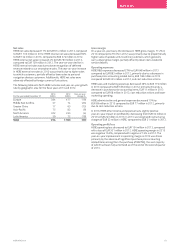
Gross margin
Nokia Networks gross margin in 2014 was 38.7%, compared to 36.6%
in 2013. The increase in Nokia Networks gross margin was primarily
attributable to a higher proportion of Mobile Broadband in the overall
sales mix and an increase in the gross margin of Global Services, partly
oset by a slight decrease in the gross margin of Mobile Broadband.
The decrease in the gross margin of Mobile Broadband was primarily
attributable to a lower gross margin in mature radio technologies. The
decrease was partially oset by a higher gross margin in LTE and core
networking technologies. In addition, Mobile Broadband gross margin
in 2014 benetted from lower costs incurred in anticipation of a
technology shift to TD-LTE, which adversely aected the gross margin
of Mobile Broadband in 2013.
The increase in the gross margin of Global Services was primarily
attributable to a more favorable sales mix including a lower proportion
of managed services and a higher proportion of systems integration in
the sales mix, as well as margin improvement in systems integration.
The increase was partially oset by lower gross margin in care,
networkimplementation and network planning and optimization.
Operating expenses
Nokia Networks R&D expenses were EUR 1 786 million in 2014, a
decrease of EUR 36 million, or 2%, compared to EUR 1 822 million in
2013. The decrease was primarily attributable to lower subcontracting
costs. The decrease was partially oset by headcount increases mainly
related to increased in-house activities. Nokia Networks continues
to invest in targeted growth areas, most notably LTE, small cells and
Telco Cloud, while reducing investments in mature technologies.
Nokia Networks selling, general and administrative expenses were
EUR 1 236 million in 2014, a decrease of EUR 74 million, or 6%,
compared to EUR 1 310 million in 2013. The decrease was primarily
attributable to structural cost savings from Nokia Networks’ global
restructuring program. The decrease was partially oset by headcount
increases related to an increased focus on growth.
Nokia Networks other income and expenses decreased in 2014 to an
expense of EUR 104 million from an expense of EUR 582 million in
2013. In 2014, other income and expenses included restructuring
and associated charges of EUR 57 million and anticipated contractual
remediation costs of EUR 31 million. In 2013, other income and
expenses included restructuring and associated charges of
EUR570million.