Nokia 2014 Annual Report Download - page 170
Download and view the complete annual report
Please find page 170 of the 2014 Nokia annual report below. You can navigate through the pages in the report by either clicking on the pages listed below, or by using the keyword search tool below to find specific information within the annual report.-
 1
1 -
2
-
3
-
4
-
5
-
6
-
7
-
8
-
9
-
10
-
11
-
12
-
13
-
14
-
15
-
16
-
17
-
18
-
19
-
20
-
21
-
22
-
23
-
24
-
25
-
26
-
27
-
28
-
29
-
30
-
31
-
32
-
33
-
34
-
35
-
36
-
37
-
38
-
39
-
40
-
41
-
42
-
43
-
44
-
45
-
46
-
47
-
48
-
49
-
50
-
51
-
52
-
53
-
54
-
55
-
56
-
57
-
58
-
59
-
60
-
61
-
62
-
63
-
64
-
65
-
66
-
67
-
68
-
69
-
70
-
71
-
72
-
73
-
74
-
75
-
76
-
77
-
78
-
79
-
80
-
81
-
82
-
83
-
84
-
85
-
86
-
87
-
88
-
89
-
90
-
91
-
92
-
93
-
94
-
95
-
96
-
97
-
98
-
99
-
100
-
101
-
102
-
103
-
104
-
105
-
106
-
107
-
108
-
109
-
110
-
111
-
112
-
113
-
114
-
115
-
116
-
117
-
118
-
119
-
120
-
121
-
122
-
123
-
124
-
125
-
126
-
127
-
128
-
129
-
130
-
131
-
132
-
133
-
134
-
135
-
136
-
137
-
138
-
139
-
140
-
141
-
142
-
143
-
144
-
145
-
146
-
147
-
148
-
149
-
150
-
151
-
152
-
153
-
154
-
155
-
156
-
157
-
158
-
159
-
 160
160 -
 161
161 -
 162
162 -
 163
163 -
 164
164 -
 165
165 -
 166
166 -
 167
167 -
 168
168 -
 169
169 -
 170
170 -
 171
171 -
 172
172 -
 173
173 -
 174
174 -
 175
175 -
 176
176 -
 177
177 -
 178
178 -
 179
179 -
 180
180 -
181
-
182
-
183
-
184
-
185
-
186
-
187
-
188
-
189
-
190
-
191
-
192
-
193
-
194
-
195
-
196
-
197
-
198
-
199
-
200
-
201
-
202
-
203
-
204
-
205
-
206
-
207
-
208
-
209
-
210
-
211
-
212
-
213
-
214
-
215
-
216
 |
 |

168 NOKIA IN 2014
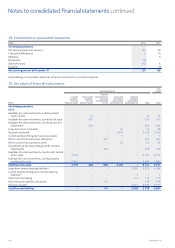
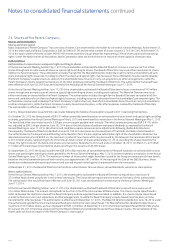
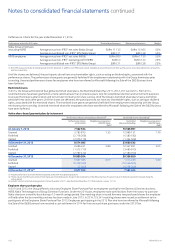
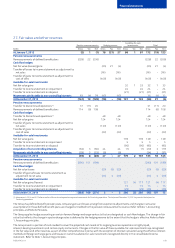
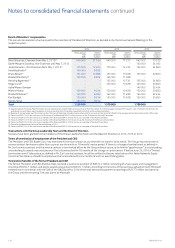
Notes to consolidated nancial statements continued
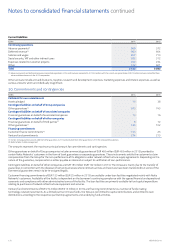
26. Translation dierences
EURm
Translation differences Net investment hedging Total
Gross Tax Net Gross Tax Net Gross Tax Net
At January 1, 2012 918 4922 (211) 60 (151) 707 64 771
Exchange dierences on translating
foreignoperations 42 (1) 41 – – – 42 (1) 41
Transfer to income statement (1) –(1) – – – (1) –(1)
Net investment hedging losses – – – (58) (9) (67) (58) (9) (67)
Movements attributable to non-controlling
interests 2 – 2 – – – 2 – 2
At December 31, 2012 961 3964 (269) 51 (218) 692 54 746
Exchange dierences on translating
foreignoperations (496) –(496) – – – (496) –(496)
Net investment hedging gains – – – 114 –114 114 –114
Acquisition of non-controlling interests 42 –42 – – – 42 –42
Movements attributable to non-controlling
interests 28 –28 – – – 28 –28
At December 31, 2013 535 3538 (155) 51 (104) 380 54 434
Exchange dierences on translating
foreignoperations 628 –628 – – – 628 –628
Transfer to income statement(1) 192 –192 –––192 –192
Net investment hedging (losses)/gains – – – (187) 34 (153) (187) 34 (153)
Transfer to income statement(1) – – – 20 (15) 5 20 (15) 5
Movements attributable to non-controlling
interests (7) –(7) – – – (7) –(7)
At December 31, 2014 1 348 31 351 (322) 70 (252) 1 026 73 1 099
(1) Reclassied from other comprehensive income to the consolidated income statement primarily due to the Sale of the D&S Business.