Nokia 2014 Annual Report Download - page 54
Download and view the complete annual report
Please find page 54 of the 2014 Nokia annual report below. You can navigate through the pages in the report by either clicking on the pages listed below, or by using the keyword search tool below to find specific information within the annual report.-
 1
1 -
2
-
3
-
4
-
5
-
6
-
7
-
8
-
9
-
10
-
11
-
12
-
13
-
14
-
15
-
16
-
17
-
18
-
19
-
20
-
21
-
22
-
23
-
24
-
25
-
26
-
27
-
28
-
29
-
30
-
31
-
32
-
33
-
34
-
35
-
36
-
37
-
38
-
39
-
40
-
41
-
42
-
43
-
 44
44 -
 45
45 -
 46
46 -
 47
47 -
 48
48 -
 49
49 -
 50
50 -
 51
51 -
 52
52 -
 53
53 -
 54
54 -
 55
55 -
 56
56 -
 57
57 -
 58
58 -
 59
59 -
 60
60 -
 61
61 -
 62
62 -
 63
63 -
 64
64 -
65
-
66
-
67
-
68
-
69
-
70
-
71
-
72
-
73
-
74
-
75
-
76
-
77
-
78
-
79
-
80
-
81
-
82
-
83
-
84
-
85
-
86
-
87
-
88
-
89
-
90
-
91
-
92
-
93
-
94
-
95
-
96
-
97
-
98
-
99
-
100
-
101
-
102
-
103
-
104
-
105
-
106
-
107
-
108
-
109
-
110
-
111
-
112
-
113
-
114
-
115
-
116
-
117
-
118
-
119
-
120
-
121
-
122
-
123
-
124
-
125
-
126
-
127
-
128
-
129
-
130
-
131
-
132
-
133
-
134
-
135
-
136
-
137
-
138
-
139
-
140
-
141
-
142
-
143
-
144
-
145
-
146
-
147
-
148
-
149
-
150
-
151
-
152
-
153
-
154
-
155
-
156
-
157
-
158
-
159
-
160
-
161
-
162
-
163
-
164
-
165
-
166
-
167
-
168
-
169
-
170
-
171
-
172
-
173
-
174
-
175
-
176
-
177
-
178
-
179
-
180
-
181
-
182
-
183
-
184
-
185
-
186
-
187
-
188
-
189
-
190
-
191
-
192
-
193
-
194
-
195
-
196
-
197
-
198
-
199
-
200
-
201
-
202
-
203
-
204
-
205
-
206
-
207
-
208
-
209
-
210
-
211
-
212
-
213
-
214
-
215
-
216
 |
 |

52 NOKIA IN 2014
Results of operations continued
Discontinued operations
For the year ended December 31, 2014 compared to the year ended December 31, 2013
As the Sale of the D&S Business closed on April 25, 2014, the nancial results of the Discontinued operations in 2014 are not comparable to the
nancial results of the Discontinued operations in 2013.
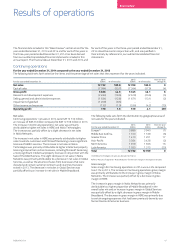
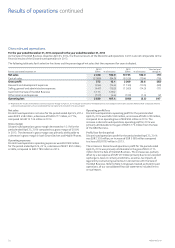
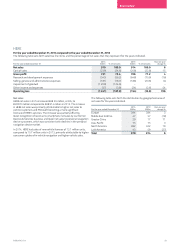
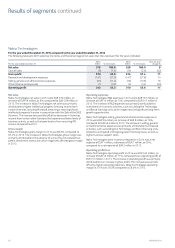
The following table sets forth selective line items and the percentage of net sales that they represent for years indicated.
For the year ended December 31
2014(1)
EURm % of net sales
2013
EURm % of net sales
Year-on-year
change %
Net sales 2 458 100.0 10 735 100.0 (77)
Cost of sales (2 086) (84.9) (8 526) (79.4) (76)
Gross prot 372 15.1 2 209 20.6 (83)
Research and development expenses (354) (14.4) (1 130) (10.5) (69)
Selling, general and administrative expenses (447) (18.2) (1 560) (14.5) (71)
Gain from the Sale of the D&S Business 3 175 129.2 – –
Other income and expenses (107) (4.4) (109) (1.0) (2)
Operating loss 2 639 107.4 (590) (5.5) 547
(1) Represents the results of the Devices & Services business through to April 25, 2014, the gain on the Sale of the D&S Business and subsequent wind-down activities. Refer to Note 3, Disposals treated
as discontinued operations, of our consolidated nancial statements included in this annual report.
Net sales
Discontinued operations net sales for the period ended April 25, 2014
were EUR 2 458 million, a decrease of EUR 8 277 million, or 77%,
compared to EUR 10 735 million in 2013.
Gross margin
Discontinued operations gross margin decreased to 15.1% for the
period ended April 25, 2014 compared to a gross margin of 20.6%
in 2013. The decrease in gross margin was primarily attributable to
a decrease in gross margin in both Smart Devices and Mobile Phones.
Operating expenses
Discontinued operations operating expenses were EUR 908 million
for the period ended April 25, 2014, a decrease of EUR 1 891 million,
or 68%, compared to EUR 2 799 million in 2013.
Operating prot/loss
Discontinued operations operating prot for the period ended
April25, 2014 was EUR 2 639 million, an increase of EUR 3 229 million,
compared to an operating loss of EUR 590 million in 2013. The
increase in discontinued operations operating prot in 2014 was
primarily attributable to the gain of EUR 3 175 million from the Sale
ofthe D&S Business.
Prot/loss for the period
Discontinued operations prot for the period ended April 25, 2014
was EUR 2 305 million, an increase of EUR 3 085 million compared
to aloss of EUR 780 million in 2013.
The increase in Discontinued operations prot for the period ended
April 25, 2014 was primarily attributable to the gain of EUR 3 175
million from the Sale of the D&S Business. The increase was partially
oset by a tax expense of EUR 127 million primarily due to non-resident
capital gains taxes in certain jurisdictions, as well as tax impacts of
legal entity restructuring carried out in connection with theSale of
the D&S Business. Refer to Note 3, Disposals treated as discontinued
operations, of our consolidated nancial statements included in this
annual report.