Nokia 2014 Annual Report Download - page 198
Download and view the complete annual report
Please find page 198 of the 2014 Nokia annual report below. You can navigate through the pages in the report by either clicking on the pages listed below, or by using the keyword search tool below to find specific information within the annual report.-
 1
1 -
2
-
3
-
4
-
5
-
6
-
7
-
8
-
9
-
10
-
11
-
12
-
13
-
14
-
15
-
16
-
17
-
18
-
19
-
20
-
21
-
22
-
23
-
24
-
25
-
26
-
27
-
28
-
29
-
30
-
31
-
32
-
33
-
34
-
35
-
36
-
37
-
38
-
39
-
40
-
41
-
42
-
43
-
44
-
45
-
46
-
47
-
48
-
49
-
50
-
51
-
52
-
53
-
54
-
55
-
56
-
57
-
58
-
59
-
60
-
61
-
62
-
63
-
64
-
65
-
66
-
67
-
68
-
69
-
70
-
71
-
72
-
73
-
74
-
75
-
76
-
77
-
78
-
79
-
80
-
81
-
82
-
83
-
84
-
85
-
86
-
87
-
88
-
89
-
90
-
91
-
92
-
93
-
94
-
95
-
96
-
97
-
98
-
99
-
100
-
101
-
102
-
103
-
104
-
105
-
106
-
107
-
108
-
109
-
110
-
111
-
112
-
113
-
114
-
115
-
116
-
117
-
118
-
119
-
120
-
121
-
122
-
123
-
124
-
125
-
126
-
127
-
128
-
129
-
130
-
131
-
132
-
133
-
134
-
135
-
136
-
137
-
138
-
139
-
140
-
141
-
142
-
143
-
144
-
145
-
146
-
147
-
148
-
149
-
150
-
151
-
152
-
153
-
154
-
155
-
156
-
157
-
158
-
159
-
160
-
161
-
162
-
163
-
164
-
165
-
166
-
167
-
168
-
169
-
170
-
171
-
172
-
173
-
174
-
175
-
176
-
177
-
178
-
179
-
180
-
181
-
182
-
183
-
184
-
185
-
186
-
187
-
 188
188 -
 189
189 -
 190
190 -
 191
191 -
 192
192 -
 193
193 -
 194
194 -
 195
195 -
 196
196 -
 197
197 -
 198
198 -
 199
199 -
 200
200 -
 201
201 -
 202
202 -
 203
203 -
 204
204 -
 205
205 -
 206
206 -
 207
207 -
 208
208 -
209
-
210
-
211
-
212
-
213
-
214
-
215
-
216
 |
 |
196 NOKIA IN 2014
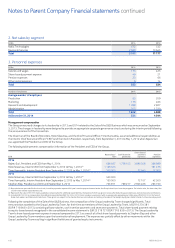
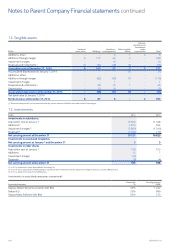
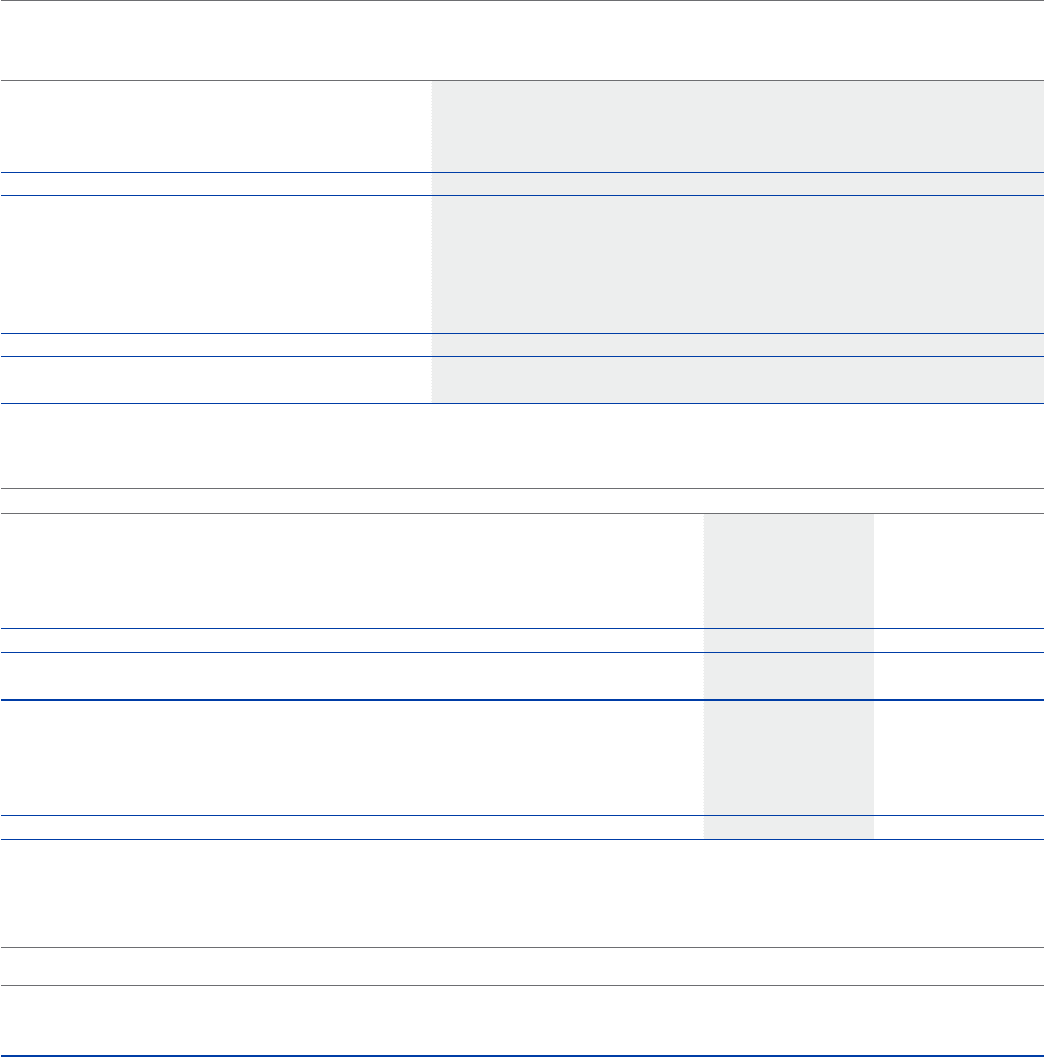
12. Tangible assets
EURm
Land and
water areas Buildings
Machinery
and equipment
Other tangible
assets
Advance
payments and
fixed assets
under
construction Total
Additions, other – – 2 1 2 5
Additions through merger 9 177 40 2 – 228
Impairment charges – – (1) – – (1)
Disposals and retirements (1) (1) (34) (18) (2) – (55)
Acquisition cost at December 31 , 2014 8 143 23 1 2 177
Accumulated depreciation at January 1, 2014 – – – (1) – (1)
Additions, other ––––––
Additions through merger – (82) (33) (1) – (116)
Impairment charges – – 1 – – 1
Disposals and retirements (1) – 28 16 1 – 45
Depreciation – (2) (1) – – (3)
Accumulated depreciation at December 31, 2014 – (56) (17) (1) – (74)
Net book value at January 1, 2014 – – – – – –
Net book value at December 31, 2014 8 87 6 – 2 103
(1) Disposals relate primarily to the transaction whereby certain assets and liabilities were sold to Nokia Technologies.
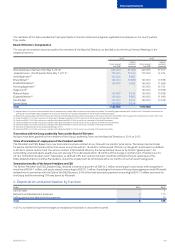
13. Investments
EURm 2014 2013
Investments in subsidiaries
Acquisition cost at January 1 10 625 11 548
Additions(1) 4 970 354
Impairment charges(2) (3 800) (1 240)
Disposals(3) (1 644) ( 37)
Net carrying amount at December 31 10 151 10 625
Investments in associated companies
Net carrying amount at January 1 and December 31 3 3
Investments in other shares
Acquisition cost at January 1 108 105
Additions 15 7
Impairment charges (12) –
Disposals (6) ( 4)
Net carrying amount at December 31 105 108
(1) In 2014, relates to the newly formed Nokia Technology Oy.
(2) In 2014, the carrying values of shareholdings in subsidiaries were reviewed resulting in impairment charges in Nokia Inc. and the HERE business.
(3) In 2014, relates to the Sale of the D&S Business.
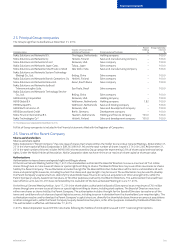
Investments in associated companies comprise of:
Associated company
Ownership
%
Carrying amount
EURk
Sapura-Nokia Telecommunication Sdn Bhd 40% 1 242
Noksel A.S 20% 986
Sapura Nokia Software Sdn Bhd 50% 375
Notes to Parent Company Financial statements continued