Nokia 2014 Annual Report Download - page 200
Download and view the complete annual report
Please find page 200 of the 2014 Nokia annual report below. You can navigate through the pages in the report by either clicking on the pages listed below, or by using the keyword search tool below to find specific information within the annual report.-
 1
1 -
2
-
3
-
4
-
5
-
6
-
7
-
8
-
9
-
10
-
11
-
12
-
13
-
14
-
15
-
16
-
17
-
18
-
19
-
20
-
21
-
22
-
23
-
24
-
25
-
26
-
27
-
28
-
29
-
30
-
31
-
32
-
33
-
34
-
35
-
36
-
37
-
38
-
39
-
40
-
41
-
42
-
43
-
44
-
45
-
46
-
47
-
48
-
49
-
50
-
51
-
52
-
53
-
54
-
55
-
56
-
57
-
58
-
59
-
60
-
61
-
62
-
63
-
64
-
65
-
66
-
67
-
68
-
69
-
70
-
71
-
72
-
73
-
74
-
75
-
76
-
77
-
78
-
79
-
80
-
81
-
82
-
83
-
84
-
85
-
86
-
87
-
88
-
89
-
90
-
91
-
92
-
93
-
94
-
95
-
96
-
97
-
98
-
99
-
100
-
101
-
102
-
103
-
104
-
105
-
106
-
107
-
108
-
109
-
110
-
111
-
112
-
113
-
114
-
115
-
116
-
117
-
118
-
119
-
120
-
121
-
122
-
123
-
124
-
125
-
126
-
127
-
128
-
129
-
130
-
131
-
132
-
133
-
134
-
135
-
136
-
137
-
138
-
139
-
140
-
141
-
142
-
143
-
144
-
145
-
146
-
147
-
148
-
149
-
150
-
151
-
152
-
153
-
154
-
155
-
156
-
157
-
158
-
159
-
160
-
161
-
162
-
163
-
164
-
165
-
166
-
167
-
168
-
169
-
170
-
171
-
172
-
173
-
174
-
175
-
176
-
177
-
178
-
179
-
180
-
181
-
182
-
183
-
184
-
185
-
186
-
187
-
188
-
189
-
 190
190 -
 191
191 -
 192
192 -
 193
193 -
 194
194 -
 195
195 -
 196
196 -
 197
197 -
 198
198 -
 199
199 -
 200
200 -
 201
201 -
 202
202 -
 203
203 -
 204
204 -
 205
205 -
 206
206 -
 207
207 -
 208
208 -
 209
209 -
 210
210 -
211
-
212
-
213
-
214
-
215
-
216
 |
 |

198 NOKIA IN 2014
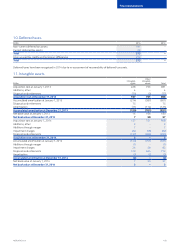
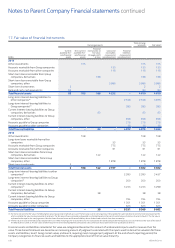
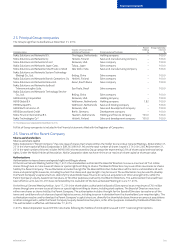
17. Fair value of nancial instruments
EURm
Carrying amounts
Total carrying
amounts Fair value(1)
Current
available-for-
sale financial
assets
Non-current
available-for-
sale financial
assets
Financial
instruments at
fair value
through profit
or loss
Loans and
receivables
measured at
amortized cost
Financial
liabilities
measured at
amortized cost
2014
Other investments 105 105 105
Accounts receivable from Group companies 150 150 150
Accounts receivable from other companies 116 116 116
Short-term loans receivable from Group
companies, derivatives 168 168 168
Short-term loans receivable from Group
companies, other 3 986 3 986 3 986
Short-term investments 2 2 2
Bank and cash, cash equivalents 83 83 83
Total nancial assets 85 105 168 4 252 –4 610 4 610
Long-term interest-bearing liabilities to
other companies(2) 2 558 2 558 3 976
Long-term interest-bearing liabilities to
Group companies(2) 283 283 283
Current interest-bearing liabilities to Group
companies, derivatives 63 63 63
Current interest-bearing liabilities to Group
companies, other 939 939 939
Accounts payable to Group companies 216 216 216
Accounts payable to other companies 16 16 16
Total nancial liabilities – – 63 –4 012 4 075 5 493
2013
Other investments 108 108 108
Long-term loans receivable from other
companies 53 53 53
Accounts receivable from Group companies 775 775 775
Accounts receivable from other companies 61 61 61
Short-term loans receivables from Group
companies, derivatives 142 142 142
Short-term loans receivables from Group
companies, other 1 878 1 878 1 878
Short-term investments 5 5 5
Total nancial assets 5108 142 2 767 –3 022 3 022
Long-term interest-bearing liabilities to other
companies(2) 2 390 2 390 3 457
Long-term interest-bearing liabilities to Group
companies(2) 200 200 200
Current interest-bearing liabilities to other
companies(2) 3 253 3 253 3 299
Current interest-bearing liabilities to Group
companies, derivatives 38 38 38
Current interest-bearing liabilities to Group
companies, other 764 764 764
Accounts payable to Group companies 1 301 1 301 1 301
Accounts payable to other companies 623 623 623
Total nancial liabilities – – 38 –8 531 8 569 9 682
(1) For items not carried at fair value, the following fair value measurement methods are used. The fair value is set to carrying amount for available-for-sale investments carried at cost less impairment for
which no reliable fair value has been possible to estimate. The fair value of loans receivable and payable is estimated based on the current market values of similar instruments (level 2). The fair value is
estimated to be equal to the carrying amount for short-term nancial assets and nancial liabilities due to limited credit risk and short time to maturity.
(2) The fair value of euro convertible bonds (total of EUR 1 500 million maturing 2018-2020) at end of 2013 was based on the bonds being redeemed at par plus accrued interest at the close of the Sale of
the D&S Business (Level 3). The fair values of other long-term interest-bearing liabilities are based on discounted cash ow analysis (level 2) or quoted prices (level 1).
Financial assets and liabilities recorded at fair value are categorized based on the amount of unobservable inputs used to measure their fair
value. Three hierarchical levels are based on an increasing amount of judgment associated with the inputs used to derive fair valuation for these
assets and liabilities, level 1 being market values and level 3, requiring most management judgment. At the end of each reporting period, the
Company categorizes its nancial assets and liabilities to the appropriate level of the fair value hierarchy.
Notes to Parent Company Financial statements continued