Nokia 2014 Annual Report Download - page 180
Download and view the complete annual report
Please find page 180 of the 2014 Nokia annual report below. You can navigate through the pages in the report by either clicking on the pages listed below, or by using the keyword search tool below to find specific information within the annual report.-
 1
1 -
2
-
3
-
4
-
5
-
6
-
7
-
8
-
9
-
10
-
11
-
12
-
13
-
14
-
15
-
16
-
17
-
18
-
19
-
20
-
21
-
22
-
23
-
24
-
25
-
26
-
27
-
28
-
29
-
30
-
31
-
32
-
33
-
34
-
35
-
36
-
37
-
38
-
39
-
40
-
41
-
42
-
43
-
44
-
45
-
46
-
47
-
48
-
49
-
50
-
51
-
52
-
53
-
54
-
55
-
56
-
57
-
58
-
59
-
60
-
61
-
62
-
63
-
64
-
65
-
66
-
67
-
68
-
69
-
70
-
71
-
72
-
73
-
74
-
75
-
76
-
77
-
78
-
79
-
80
-
81
-
82
-
83
-
84
-
85
-
86
-
87
-
88
-
89
-
90
-
91
-
92
-
93
-
94
-
95
-
96
-
97
-
98
-
99
-
100
-
101
-
102
-
103
-
104
-
105
-
106
-
107
-
108
-
109
-
110
-
111
-
112
-
113
-
114
-
115
-
116
-
117
-
118
-
119
-
120
-
121
-
122
-
123
-
124
-
125
-
126
-
127
-
128
-
129
-
130
-
131
-
132
-
133
-
134
-
135
-
136
-
137
-
138
-
139
-
140
-
141
-
142
-
143
-
144
-
145
-
146
-
147
-
148
-
149
-
150
-
151
-
152
-
153
-
154
-
155
-
156
-
157
-
158
-
159
-
160
-
161
-
162
-
163
-
164
-
165
-
166
-
167
-
168
-
169
-
 170
170 -
 171
171 -
 172
172 -
 173
173 -
 174
174 -
 175
175 -
 176
176 -
 177
177 -
 178
178 -
 179
179 -
 180
180 -
 181
181 -
 182
182 -
 183
183 -
 184
184 -
 185
185 -
 186
186 -
 187
187 -
 188
188 -
 189
189 -
 190
190 -
191
-
192
-
193
-
194
-
195
-
196
-
197
-
198
-
199
-
200
-
201
-
202
-
203
-
204
-
205
-
206
-
207
-
208
-
209
-
210
-
211
-
212
-
213
-
214
-
215
-
216
 |
 |
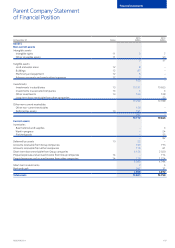
178 NOKIA IN 2014
Notes to consolidated nancial statements continued
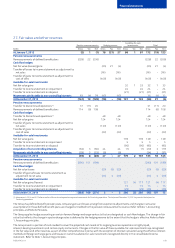
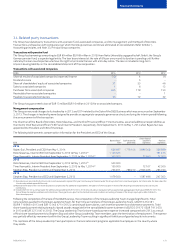
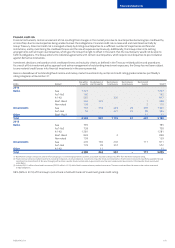
Currencies that represent a signicant portion of the currency mix in outstanding nancial instruments at December 31 are as follows:
EURm USD JPY CNY KRW
2014
Foreign exchange derivatives used as cash ow hedges, net(1) (198) (365) – –
Foreign exchange derivatives used as net investment hedges, net(2) (1 808) –––
Foreign exchange exposure from statement of nancial position items, net(3) (2 272) 224 325 127
Foreign exchange derivatives not designated in a hedge relationship,
carried at fair value through prot and loss, net(3) 1 670 (272) (371) (159)
Cross-currency/interest rate hedges 440 – – –
EURm USD JPY CNY KRW
2013
Foreign exchange derivatives used as cash ow hedges, net(1) (409) (232) – –
Foreign exchange derivatives used as net investment hedges, net(2) (724) (14) (358) (62)
Foreign exchange exposure from statement of nancial position items, net(3) (217) 36 (47) 57
Foreign exchange derivatives not designated in a hedge relationship,
carried at fair value through prot and loss, net(3) (367) (116) 81 (94)
Cross-currency/interest rate hedges 390 – – –
(1) Used to hedge the foreign exchange risk from forecasted highly probable cash ows related to sales, purchases and business acquisition activities. In some currencies, especially the U.S. dollar, the
Group has substantial foreign exchange risks in both estimated cash inows and outows. The underlying exposures for which these hedges are entered into are not presented in the table as they are
not nancial instruments.
(2) Used to hedge the Group’s net investment exposure. The underlying exposures for which these hedges are entered into are not presented in the table as they are not nancial instruments.
(3) The statement of nancial position items and some probable forecasted cash ows which are denominated in foreign currencies are hedged by a portion of foreign exchange derivatives not designated
in a hedge relationship and carried at fair value through prot and loss.
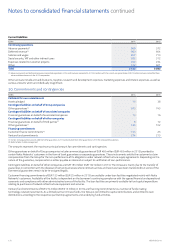
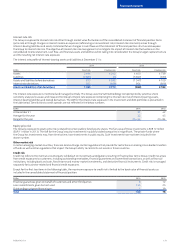
The VaR gures for the Group’s nancial instruments which are sensitive to foreign exchange risks are presented in the table below. The VaR
calculation includes foreign currency denominated monetary nancial instruments such as: available-for-sale investments, loans and accounts
receivable, investments at fair value through prot and loss, cash, loans and accounts payable; foreign exchange derivatives carried at fair value
through prot and loss which are not in a hedge relationship and are mostly used to hedge the statement of nancial position foreign exchange
exposure; and foreign exchange derivatives designated as forecasted cash ow hedges and net investment hedges. Most of the VaR is caused
by these derivatives as forecasted cash ow and net investment exposures are not nancial instruments as dened in IFRS 7, Financial
Instruments: Disclosures, and thus not included in the VaR calculation.
EURm
2014 2013
VaR from financial instruments
At December 31 79 42
Average for the year 54 114
Range for the year 30-94 42-188