Nokia 2014 Annual Report Download - page 43
Download and view the complete annual report
Please find page 43 of the 2014 Nokia annual report below. You can navigate through the pages in the report by either clicking on the pages listed below, or by using the keyword search tool below to find specific information within the annual report.-
 1
1 -
2
-
3
-
4
-
5
-
6
-
7
-
8
-
9
-
10
-
11
-
12
-
13
-
14
-
15
-
16
-
17
-
18
-
19
-
20
-
21
-
22
-
23
-
24
-
25
-
26
-
27
-
28
-
29
-
30
-
31
-
32
-
 33
33 -
 34
34 -
 35
35 -
 36
36 -
 37
37 -
 38
38 -
 39
39 -
 40
40 -
 41
41 -
 42
42 -
 43
43 -
 44
44 -
 45
45 -
 46
46 -
 47
47 -
 48
48 -
 49
49 -
 50
50 -
 51
51 -
 52
52 -
 53
53 -
54
-
55
-
56
-
57
-
58
-
59
-
60
-
61
-
62
-
63
-
64
-
65
-
66
-
67
-
68
-
69
-
70
-
71
-
72
-
73
-
74
-
75
-
76
-
77
-
78
-
79
-
80
-
81
-
82
-
83
-
84
-
85
-
86
-
87
-
88
-
89
-
90
-
91
-
92
-
93
-
94
-
95
-
96
-
97
-
98
-
99
-
100
-
101
-
102
-
103
-
104
-
105
-
106
-
107
-
108
-
109
-
110
-
111
-
112
-
113
-
114
-
115
-
116
-
117
-
118
-
119
-
120
-
121
-
122
-
123
-
124
-
125
-
126
-
127
-
128
-
129
-
130
-
131
-
132
-
133
-
134
-
135
-
136
-
137
-
138
-
139
-
140
-
141
-
142
-
143
-
144
-
145
-
146
-
147
-
148
-
149
-
150
-
151
-
152
-
153
-
154
-
155
-
156
-
157
-
158
-
159
-
160
-
161
-
162
-
163
-
164
-
165
-
166
-
167
-
168
-
169
-
170
-
171
-
172
-
173
-
174
-
175
-
176
-
177
-
178
-
179
-
180
-
181
-
182
-
183
-
184
-
185
-
186
-
187
-
188
-
189
-
190
-
191
-
192
-
193
-
194
-
195
-
196
-
197
-
198
-
199
-
200
-
201
-
202
-
203
-
204
-
205
-
206
-
207
-
208
-
209
-
210
-
211
-
212
-
213
-
214
-
215
-
216
 |
 |

Business overview
41NOKIA IN 2014
Cost of components and raw materials
There are several factors driving Nokia
Networks’ protability: scale, operational
eciency, and pricing and cost discipline
have been, and will continue to be,
important factors aecting protability and
competitiveness. Nokia Networks product
costs comprise, among others, components,
manufacturing, labor and overhead, royalties
and licensing fees, depreciation of product
machinery, logistics and warranty and other
quality costs.
Targets and priorities
Over the long term, Nokia targets to grow
Nokia Networks’ net sales slightly faster than
the market.
Nokia expects Nokia Networks’ operating
margin for the full year 2015 to be in-line with
Nokia Networks’ targeted long-term operating
margin range of 8% to 11%, excluding special
items and purchase price accounting related
items. In addition, Nokia expects Nokia
Networks’ net sales to grow on a year-on-year
basis for the full year 2015. This outlook is
based on Nokia’s expectations regarding a
number of factors,including:
■competitive industry dynamics;
■product and regional mix;
■the timing of major new network
deployments; and
■expected continued improvement under
Nokia Networks’ transformation programs.
HERE
Our HERE business is a leading provider
of maps and location experiences across
multiple screens and operating systems and is
focused on producing the most accurate and
fresh map content, available across multiple
devices and operating systems. HERE
continues to invest in its leading location
cloud to make it the source of location
intelligence and experiences across many
dierent operating systems, platforms and
screens. We believe that location is an
essential element of the Programmable World,
hence HERE is targeting its investments in
three areas: 1) Automotive, for location
content and technology for smart, connected
and automated cars; 2) Enterprise, for
location-based analytics for better business
decisions; and 3) Consumer, for serving
ecosystem players through cloud-based
services for personal mobility and location
intelligence through seamless experiences
across multiple screens. For more information
on the HERE business, refer to “Business
overview—HERE”.
Seasonality
HERE’s sales to the automotive industry
are aected by seasonality in the automobile
market, navigation device market, and mobile
device market, with generally higher sales
inthe fourth quarter compared to the rst
quarter of the following year.
Vertical and horizontal opportunities in map
content, platform and applications
HERE is a leading provider of map content
and is focused on providing the richest, most
accurate and most current maps, since these
attributes are becoming more important for
consumers and providers of location services.
HERE’s ability to oer independent solutions
at various levels of the value chain oers both
vertical and horizontal opportunities. HERE
sees opportunities in being able to oer
solutions across ecosystems and dierent
layers within them, as well as with dierent
types of devices.
HERE’s map data provides a strong
foundation, and HERE’s cloud-based map
platform enables it to compete at multiple
levels of the location services value chain
including partnering with automobile vendors
and internet services companies for their
own dierentiated oerings.
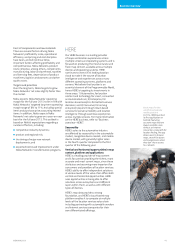
Great maps for the
world’s most popular
mobile platform
In 2014, HERE launched
its rst application on
Android, featuring
accurate maps that are
always available, even
without an internet
connection. Using GPS for
location nding, the app
allows users to browse
maps, search for places
and navigate even when
they don’t have access
to a network.