Nokia 2014 Annual Report Download - page 161
Download and view the complete annual report
Please find page 161 of the 2014 Nokia annual report below. You can navigate through the pages in the report by either clicking on the pages listed below, or by using the keyword search tool below to find specific information within the annual report.-
 1
1 -
2
-
3
-
4
-
5
-
6
-
7
-
8
-
9
-
10
-
11
-
12
-
13
-
14
-
15
-
16
-
17
-
18
-
19
-
20
-
21
-
22
-
23
-
24
-
25
-
26
-
27
-
28
-
29
-
30
-
31
-
32
-
33
-
34
-
35
-
36
-
37
-
38
-
39
-
40
-
41
-
42
-
43
-
44
-
45
-
46
-
47
-
48
-
49
-
50
-
51
-
52
-
53
-
54
-
55
-
56
-
57
-
58
-
59
-
60
-
61
-
62
-
63
-
64
-
65
-
66
-
67
-
68
-
69
-
70
-
71
-
72
-
73
-
74
-
75
-
76
-
77
-
78
-
79
-
80
-
81
-
82
-
83
-
84
-
85
-
86
-
87
-
88
-
89
-
90
-
91
-
92
-
93
-
94
-
95
-
96
-
97
-
98
-
99
-
100
-
101
-
102
-
103
-
104
-
105
-
106
-
107
-
108
-
109
-
110
-
111
-
112
-
113
-
114
-
115
-
116
-
117
-
118
-
119
-
120
-
121
-
122
-
123
-
124
-
125
-
126
-
127
-
128
-
129
-
130
-
131
-
132
-
133
-
134
-
135
-
136
-
137
-
138
-
139
-
140
-
141
-
142
-
143
-
144
-
145
-
146
-
147
-
148
-
149
-
150
-
 151
151 -
 152
152 -
 153
153 -
 154
154 -
 155
155 -
 156
156 -
 157
157 -
 158
158 -
 159
159 -
 160
160 -
 161
161 -
 162
162 -
 163
163 -
 164
164 -
 165
165 -
 166
166 -
 167
167 -
 168
168 -
 169
169 -
 170
170 -
 171
171 -
172
-
173
-
174
-
175
-
176
-
177
-
178
-
179
-
180
-
181
-
182
-
183
-
184
-
185
-
186
-
187
-
188
-
189
-
190
-
191
-
192
-
193
-
194
-
195
-
196
-
197
-
198
-
199
-
200
-
201
-
202
-
203
-
204
-
205
-
206
-
207
-
208
-
209
-
210
-
211
-
212
-
213
-
214
-
215
-
216
 |
 |
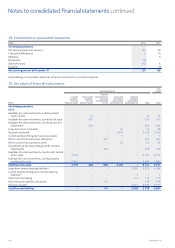
159
Financial statements
NOKIA IN 2014
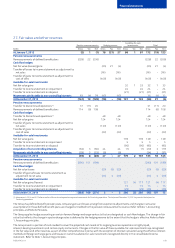
EURm
Carrying amounts
Fair
value(1)
Current
available-
for-sale
financial assets
Non-current
available-
for-sale
financial assets
Financial
instruments at
fair value
through profit
or loss
Loans and
receivables
measured at
amortized cost
Financial
liabilities
measured at
amortized cost Total Total
2013
Available-for-sale investments, publicly quoted
equity shares –11 – – – 11 11
Available-for-sale investments, carried at fair value –503 – – – 503 503
Available-for-sale investments, carried at cost less
impairment –227 – – – 227 227
Long-term loans receivable – – – 96 –96 85
Accounts receivable – – – 2 901 –2 901 2 901
Current portion of long-term loans receivable – – – 29 –29 29
Other current nancial assets, derivatives – – 191 – – 191 191
Other current nancial assets, other –––94 –94 94
Investments at fair value through prot and loss,
liquid assets – – 382 – – 382 382
Available-for-sale investments, liquid assets carried
at fair value 956 – – – – 956 956
Available for-sale investments, cash equivalents
carried at fair value 3 957 – – – – 3 957 3 957
Total nancial assets 4 913 741 573 3 120 –9 347 9 336
Long-term interest-bearing liabilities(2) – – – – 3 286 3 286 4 521
Current portion of long-term interest-bearing
liabilities(2) – – – – 3 192 3 192 3 385
Short-term borrowing – – – – 184 184 184
Other nancial liabilities, derivatives – – 35 – – 35 35
Accounts payable – – – – 1 839 1 839 1 839
Total nancial liabilities – – 35 –8 501 8 536 9 964
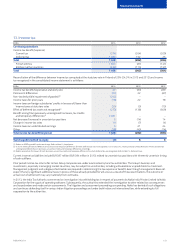
(1) The fair value is estimated to equal carrying amount for available-for-sale investments carried at cost less impairment for which it is not possible to estimate fair value reliably as there is no active
market for these private fund investments. These assets are tested for impairment annually using a discounted cash ow analysis. The fair value of loans receivable and loans payable is estimated
based on the current market values of similar instruments (level 2). The fair value is estimated to equal the carrying amount for short-term nancial assets and nancial liabilities due to limited credit
risk and short time to maturity. Refer to Note 1, Accounting principles.
(2) The fair value of euro convertible bonds (total EUR 1 500 million maturing 2018-2020) at the end of 2013 was based on the bonds being redeemed at par plus accrued interest at the close of the Sale
of the D&S Business (Level 3). The fair values of other long-term interest-bearing liabilities are based on discounted cash ow analysis (level 2) or quoted prices (level 1).