Nokia 2014 Annual Report Download - page 152
Download and view the complete annual report
Please find page 152 of the 2014 Nokia annual report below. You can navigate through the pages in the report by either clicking on the pages listed below, or by using the keyword search tool below to find specific information within the annual report.-
 1
1 -
2
-
3
-
4
-
5
-
6
-
7
-
8
-
9
-
10
-
11
-
12
-
13
-
14
-
15
-
16
-
17
-
18
-
19
-
20
-
21
-
22
-
23
-
24
-
25
-
26
-
27
-
28
-
29
-
30
-
31
-
32
-
33
-
34
-
35
-
36
-
37
-
38
-
39
-
40
-
41
-
42
-
43
-
44
-
45
-
46
-
47
-
48
-
49
-
50
-
51
-
52
-
53
-
54
-
55
-
56
-
57
-
58
-
59
-
60
-
61
-
62
-
63
-
64
-
65
-
66
-
67
-
68
-
69
-
70
-
71
-
72
-
73
-
74
-
75
-
76
-
77
-
78
-
79
-
80
-
81
-
82
-
83
-
84
-
85
-
86
-
87
-
88
-
89
-
90
-
91
-
92
-
93
-
94
-
95
-
96
-
97
-
98
-
99
-
100
-
101
-
102
-
103
-
104
-
105
-
106
-
107
-
108
-
109
-
110
-
111
-
112
-
113
-
114
-
115
-
116
-
117
-
118
-
119
-
120
-
121
-
122
-
123
-
124
-
125
-
126
-
127
-
128
-
129
-
130
-
131
-
132
-
133
-
134
-
135
-
136
-
137
-
138
-
139
-
140
-
141
-
 142
142 -
 143
143 -
 144
144 -
 145
145 -
 146
146 -
 147
147 -
 148
148 -
 149
149 -
 150
150 -
 151
151 -
 152
152 -
 153
153 -
 154
154 -
 155
155 -
 156
156 -
 157
157 -
 158
158 -
 159
159 -
 160
160 -
 161
161 -
 162
162 -
163
-
164
-
165
-
166
-
167
-
168
-
169
-
170
-
171
-
172
-
173
-
174
-
175
-
176
-
177
-
178
-
179
-
180
-
181
-
182
-
183
-
184
-
185
-
186
-
187
-
188
-
189
-
190
-
191
-
192
-
193
-
194
-
195
-
196
-
197
-
198
-
199
-
200
-
201
-
202
-
203
-
204
-
205
-
206
-
207
-
208
-
209
-
210
-
211
-
212
-
213
-
214
-
215
-
216
 |
 |

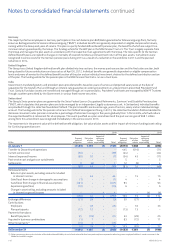
150 NOKIA IN 2014
The recoverable amount of the HERE CGU at September 30, 2014 was EUR 2 031 million, which resulted in an impairment charge of EUR 1 209
million. The impairment charge is the result of an evaluation of the projected nancial performance and net cash ows of the HERE CGU and was
allocated entirely against the carrying value of HERE goodwill. The evaluation incorporates the slower than expected increase in net sales directly
to consumers, and the Group’s plans to curtail its investment in certain higher-risk and longer-term growth opportunities. It also reects the
current assessment of risks related to the growth opportunities that management plans to continue pursuing, as well as the related terminal
value growth assumptions. After consideration of all relevant factors, management reduced the net sales projections for the HERE CGU,
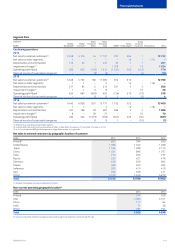
particularly in the latter years of the valuation. The HERE CGU corresponds to the HERE operating and reportable segment. Refer to Note 2,
Segment information.
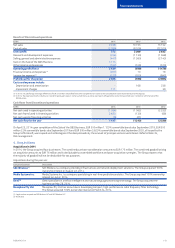
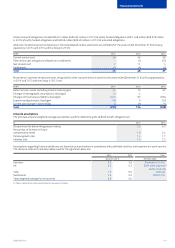
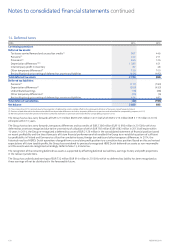
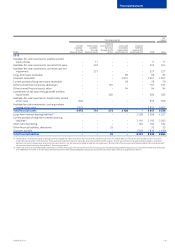
The key assumptions applied in the impairment testing analysis for each CGU are:
Key assumption %
2014 2013 2014 2013 2014 2013
HERE CGU
Radio Access Networks group
of CGUs in Mobile Broadband Global Services group of CGUs
Terminal growth rate(1) 1.2 1.7 2.6 1.5 1.6 0.5
Post-tax discount rate 11.0 10.6 9.4 10.8 9.1 10.1
(1) Based on a ve-year forecast period (ten-year forecast period in 2013).
Terminal growth rates reect long-term average growth rates for the industry and economies in which the CGUs operate. The discount rates
reect current assessments of the time value of money and relevant market risk premiums. Risk premiums reect risks and uncertainties for
which the future cash ow estimates have not been adjusted. Other key variables in future cash ow projections include assumptions on
estimated sales growth, gross margin and operating margin. All cash ow projections are consistent with external sources of information,
wherever possible.
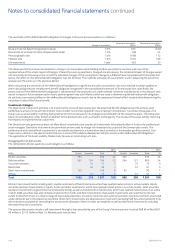
Management has determined the recoverable amount of the HERE CGU to be most sensitive to changes in both the discount rate and the
terminal growth rate. As the carrying value of the HERE CGU has been written down to its recoverable amount, any increase in the discount rate
or any decrease in the terminal growth rate would result in further impairment. Management’s estimates of the overall automotive volumes and
market share, customer adoption of the new location-based platform and related service oerings, and assumptions regarding industry pricing
are the main drivers for the HERE net cash ow projections. The Group’s cash ow forecasts reect the current strategic views that license fee
based models will remain important in both the near and long term. Management expects that when license fee-based models are augmented
with software and services, transactions fees will grow in the future as more customers demand complete, end-to-end location solutions and
as cloud computing and cloud-based services gain greater market acceptance. Actual short- and long-term performance could vary from
management’s forecasts and impact future estimates of recoverable amount.
Management has determined the discount rate and the terminal growth rate to be the key assumptions for the Nokia Networks Radio Access
Networks group of CGUs and the Global Services group of CGUs. The recoverable amounts calculated based on the sensitized assumptions do
not indicate impairment in 2014 or 2013. Further, no reasonably possible changes in other key assumptions on which the Group has based its
determination of the recoverable amounts would result in impairment in 2014 or 2013.
In 2013, the recoverable amount of the Devices & Services CGU was determined using the fair value less costs of disposal method, based on the
agreed purchase price, excluding any consideration attributable to patents or patent applications.
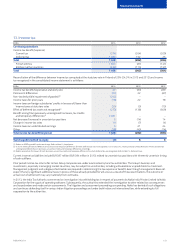
Other intangible assets
In 2012, Nokia Networks recognized an impairment charge of EUR 8 million on intangible assets attributable to the decision to transition certain
operations into maintenance mode. These charges were recorded in Other operating expenses.
Property, plant and equipment
In 2013, Nokia Networks recognized an impairment charge of EUR 6 million (EUR 23 million in 2012) following the remeasurement of the Optical
Networks disposal group at fair value less cost of disposal. In 2013, the Group recognized impairment losses of EUR 6 million relating to certain
properties attributable to Group Common Functions.
Investments in associated companies
In 2012, the Group recognized an impairment charge of EUR 8 million to adjust the Group’s investment in associated companies to the
recoverable amount. These charges were recorded in Other operating expenses and included in Group Common Functions.
Available-for-sale investments
The Group recognized an impairment charge of EUR 15 million (EUR 8 million in 2013 and EUR 31 million in 2012) as certain equity and
interest-bearing securities held as available-for-sale suered a signicant or prolonged decline in fair value. These charges are recorded in
Other expenses and Financial income and expenses.
Notes to consolidated nancial statements continued