Nokia 2006 Annual Report Download - page 76
Download and view the complete annual report
Please find page 76 of the 2006 Nokia annual report below. You can navigate through the pages in the report by either clicking on the pages listed below, or by using the keyword search tool below to find specific information within the annual report.
The following table sets forth Nokia’s total structured finance, outstanding and committed, for the
years indicated.
Structured Finance
At December 31,
2006 2005 2004
(EUR millions)
Financing commitments ************************************************** 164 13 56
Outstanding longterm loans (net of allowances and writeoffs) *************** 19 63 —
Outstanding financial guarantees and securities pledged ********************* 23 — 3
Total ******************************************************************* 206 63 59
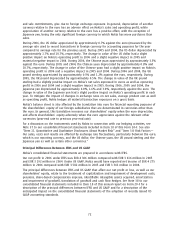
In 2006, our total structured financing, outstanding and committed, increased to EUR 206 million
from EUR 63 million in 2005 and primarily consisted of committed financing to a network operator.
Financial guarantees given on behalf of third parties of EUR 23 million were issued during 2006.
In 2005, our total structured financing primarily consisted of the funding of the EUR 56 million 2004
financing commitment to a network operator. The committed financing in 2005 of an additional
EUR 13 million to this network did not increase our total and outstanding credit risk from
EUR 63 million, as it was available only if the outstanding loan of EUR 56 million was repaid. The
guarantees of EUR 3 million outstanding in 2004 were released.
See Notes 8 and 37(b) to our consolidated financial statements included in Item 18 of this annual
report on Form 20F for additional information relating to our committed and outstanding customer
financing.
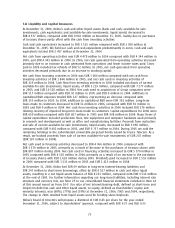
As a strategic market requirement, we plan to continue to provide customer financing and extended
payment terms to a small number of selected customers. We continue to make arrangements with
financial institutions and investors to sell credit risk we have incurred from the commitments and
outstanding loans we have made as well as from the financial guarantees we have given. Should the
demand for customer finance increase in the future, we intend to further mitigate our total
structured financing exposure, market conditions permitting.
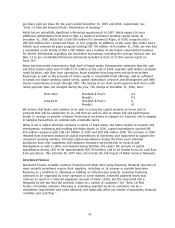
We expect our structured financing commitments to be financed mainly through cash flow from
operations as well as through the capital markets.
The structured financing commitment is available under a loan facility negotiated with a customer of
Networks. Availability of the amounts is dependent upon the borrower’s continuing compliance with
stated financial and operational covenants and compliance with other administrative terms of the
facility. The loan is available to fund capital expenditure relating to purchase of network
infrastructure equipment and services from networks.
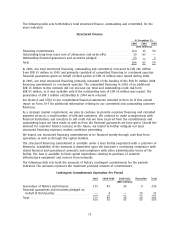
The following table sets forth the amounts of Nokia’s contingent commitments for the periods
indicated. The amounts represent the maximum principal amount of commitments.
Contingent Commitments Expiration Per Period
2007 20082009 20102011 Thereafter Total
(EUR millions)
Guarantees of Nokia’s performance ************** 175 45 30 9 259
Financial guarantees and securities pledged on
behalf of third parties *********************** —4 — 1923
Total ***************************************** 175 49 30 28 282
75


