Nokia 2006 Annual Report Download - page 74
Download and view the complete annual report
Please find page 74 of the 2006 Nokia annual report below. You can navigate through the pages in the report by either clicking on the pages listed below, or by using the keyword search tool below to find specific information within the annual report.-
 1
1 -
2
-
3
-
4
-
5
-
6
-
7
-
8
-
9
-
10
-
11
-
12
-
13
-
14
-
15
-
16
-
17
-
18
-
19
-
20
-
21
-
22
-
23
-
24
-
25
-
26
-
27
-
28
-
29
-
30
-
31
-
32
-
33
-
34
-
35
-
36
-
37
-
38
-
39
-
40
-
41
-
42
-
43
-
44
-
45
-
46
-
47
-
48
-
49
-
50
-
51
-
52
-
53
-
54
-
55
-
56
-
57
-
58
-
59
-
60
-
61
-
62
-
63
-
 64
64 -
 65
65 -
 66
66 -
 67
67 -
 68
68 -
 69
69 -
 70
70 -
 71
71 -
 72
72 -
 73
73 -
 74
74 -
 75
75 -
 76
76 -
 77
77 -
 78
78 -
 79
79 -
 80
80 -
 81
81 -
 82
82 -
 83
83 -
 84
84 -
85
-
86
-
87
-
88
-
89
-
90
-
91
-
92
-
93
-
94
-
95
-
96
-
97
-
98
-
99
-
100
-
101
-
102
-
103
-
104
-
105
-
106
-
107
-
108
-
109
-
110
-
111
-
112
-
113
-
114
-
115
-
116
-
117
-
118
-
119
-
120
-
121
-
122
-
123
-
124
-
125
-
126
-
127
-
128
-
129
-
130
-
131
-
132
-
133
-
134
-
135
-
136
-
137
-
138
-
139
-
140
-
141
-
142
-
143
-
144
-
145
-
146
-
147
-
148
-
149
-
150
-
151
-
152
-
153
-
154
-
155
-
156
-
157
-
158
-
159
-
160
-
161
-
162
-
163
-
164
-
165
-
166
-
167
-
168
-
169
-
170
-
171
-
172
-
173
-
174
-
175
-
176
-
177
-
178
-
179
-
180
-
181
-
182
-
183
-
184
-
185
-
186
-
187
-
188
-
189
-
190
-
191
-
192
-
193
-
194
-
195
-
196
-
197
-
198
-
199
-
200
-
201
-
202
-
203
-
204
-
205
-
206
-
207
-
208
-
209
-
210
-
211
-
212
-
213
-
214
-
215
-
216
 |
 |
5.B Liquidity and Capital Resources
At December 31, 2006, Nokia’s cash and other liquid assets (bank and cash; availableforsale
investments, cash equivalents; and availableforsale investments, liquid assets) decreased to
EUR 8 537 million, compared with EUR 9 910 million at December 31, 2005, mainly due to purchases
of treasury shares partly offset with the cash from investing activities.
Cash and cash equivalents increased to EUR 3 525 million compared with EUR 3 058 million at
December 31, 2005. We hold our cash and cash equivalents predominantly in euros. Cash and cash
equivalents totaled EUR 2 457 million at December 31, 2004.
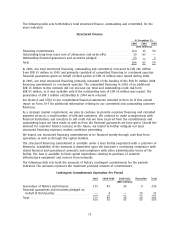
Net cash from operating activities was EUR 4 478 million in 2006 compared with EUR 4 144 million in
2005, and EUR 4 343 million in 2004. In 2006, net cash generated from operating activities increased
primarily due to an increase in cash generated from operations and lower income taxes paid. Taxes
paid in 2006 included tax refunds of EUR 52 million. In 2005, net cash generated from operating
activities decreased primarily due to an increase in working capital.
Net cash from investing activities in 2006 was EUR 1 006 million compared with net cash from
investing activities of EUR 1 844 million in 2005, and net cash used in investing activities of
EUR 329 million in 2004. Cash flow from investing activities in 2006 included purchases of current
availableforsale investments, liquid assets, of EUR 3 219 million, compared with EUR 7 277 million
in 2005, and EUR 10 318 million in 2004. Net cash used in acquisitions of Group companies were
EUR 517 million compared with EUR 92 million in 2005 and EUR 0 million in 2004. Additions to
capitalized R&D expenses totaled EUR 127 million, representing an decrease compared with
EUR 153 million in 2005. In 2004, additions to capitalized R&D were EUR 101 million. Longterm
loans made to customers decreased to EUR 11 million in 2006, compared with EUR 56 million in
2005 and EUR 0 million in 2004. Net cash from investing activities in 2006 included EUR 276 million
relating recovery of impaired longterm loans made to customers. Capital expenditures for 2006 were
EUR 650 million compared with EUR 607 million in 2005 and EUR 548 million in 2004. Major items of
capital expenditure included production lines, test equipment and computer hardware used primarily
in research and development as well as office and manufacturing facilities. Proceeds from maturities
and sale of current availableforsale investments, liquid assets, decreased to EUR 5 058 million,
compared with EUR 9 402 million in 2005, and EUR 9 737 million in 2004. During 2005 we sold the
remaining holdings in the subordinated convertible perpetual bonds issued by France Telecom. As a
result, we booked proceeds from sale of current availableforsale investments of EUR 247 million
(EUR 587 million in 2004).
Net cash used in financing activities decreased to EUR 4 966 million in 2006 compared with
EUR 5 570 million in 2005, primarily as a result of decrease in the purchases of treasury shares with
EUR 887 million during 2006. Net cash used in financing activities increased to EUR 5 570 million in
2005 compared with EUR 4 318 million in 2004, primarily as a result of an increase in the purchases
of treasury shares with EUR 1 610 million during 2005. Dividends paid increased to EUR 1 553 million
in 2006 compared with EUR 1 531 million in 2005 and EUR 1 413 million in 2004.
At December 31, 2006, Nokia had EUR 69 million in longterm interestbearing liabilities and
EUR 247 million in shortterm borrowings, offset by EUR 8 537 million in cash and other liquid
assets, resulting in a net liquid assets balance of EUR 8 221 million, compared with EUR 9 512 million
at the end of 2005. For further information regarding our longterm liabilities, including interest rate
structure and currency mix, see Note 25 to our consolidated financial statements included in Item 18
of this annual report on Form 20F. Our ratio of net interestbearing debt, defined as shortterm and
longterm debt less cash and other liquid assets, to equity, defined as shareholders’ equity and
minority interests, was (68%), (77%) and (79%) at December 31, 2006, 2005 and 2004, respectively.
The change in 2006 resulted from liquid assets used for funding share buybacks.
Nokia’s Board of Directors will propose a dividend of EUR 0.43 per share for the year ended
December 31, 2006, subject to shareholders’ approval, compared with EUR 0.37 and EUR 0.33
73