Nokia 2006 Annual Report Download - page 107
Download and view the complete annual report
Please find page 107 of the 2006 Nokia annual report below. You can navigate through the pages in the report by either clicking on the pages listed below, or by using the keyword search tool below to find specific information within the annual report.-
 1
1 -
2
-
3
-
4
-
5
-
6
-
7
-
8
-
9
-
10
-
11
-
12
-
13
-
14
-
15
-
16
-
17
-
18
-
19
-
20
-
21
-
22
-
23
-
24
-
25
-
26
-
27
-
28
-
29
-
30
-
31
-
32
-
33
-
34
-
35
-
36
-
37
-
38
-
39
-
40
-
41
-
42
-
43
-
44
-
45
-
46
-
47
-
48
-
49
-
50
-
51
-
52
-
53
-
54
-
55
-
56
-
57
-
58
-
59
-
60
-
61
-
62
-
63
-
64
-
65
-
66
-
67
-
68
-
69
-
70
-
71
-
72
-
73
-
74
-
75
-
76
-
77
-
78
-
79
-
80
-
81
-
82
-
83
-
84
-
85
-
86
-
87
-
88
-
89
-
90
-
91
-
92
-
93
-
94
-
95
-
96
-
 97
97 -
 98
98 -
 99
99 -
 100
100 -
 101
101 -
 102
102 -
 103
103 -
 104
104 -
 105
105 -
 106
106 -
 107
107 -
 108
108 -
 109
109 -
 110
110 -
 111
111 -
 112
112 -
 113
113 -
 114
114 -
 115
115 -
 116
116 -
 117
117 -
118
-
119
-
120
-
121
-
122
-
123
-
124
-
125
-
126
-
127
-
128
-
129
-
130
-
131
-
132
-
133
-
134
-
135
-
136
-
137
-
138
-
139
-
140
-
141
-
142
-
143
-
144
-
145
-
146
-
147
-
148
-
149
-
150
-
151
-
152
-
153
-
154
-
155
-
156
-
157
-
158
-
159
-
160
-
161
-
162
-
163
-
164
-
165
-
166
-
167
-
168
-
169
-
170
-
171
-
172
-
173
-
174
-
175
-
176
-
177
-
178
-
179
-
180
-
181
-
182
-
183
-
184
-
185
-
186
-
187
-
188
-
189
-
190
-
191
-
192
-
193
-
194
-
195
-
196
-
197
-
198
-
199
-
200
-
201
-
202
-
203
-
204
-
205
-
206
-
207
-
208
-
209
-
210
-
211
-
212
-
213
-
214
-
215
-
216
 |
 |

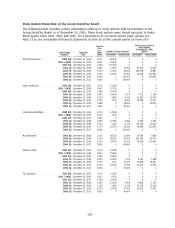
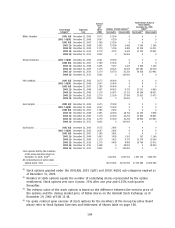
Performance Shares and Restricted Shares
The following table provides certain information relating to performance shares and restricted shares
held by members of the Group Executive Board as of December 31, 2006. These entitlements were
granted pursuant to our performance share plans 2004, 2005 and 2006 and restricted share plans
2003, 2004, 2005 and 2006. For a description of our performance share and restricted share plans,
please see Note 23 to the consolidated financial statements in Item 18 of this annual report on
Form 20F.
Performance Shares Restricted Shares
Number of Number of
Performance Performance Intrinsic Value Number of Intrinsic Value
Shares at Shares at December 31, Plan Restricted December 31,
Plan Name(1) Threshold(2) Maximum(2) 2006(3) (EUR) Name(4) Shares 2006(5) (EUR)
OlliPekka Kallasvuo***** 2004 15 000 45 000 536 255 2004 35 000 541 800
2005 15 000 60 000 881 715 2005 70 000 1 083 600
2006 75 000 300 000 2 987 751 2006 100 000 1 548 000
Robert Andersson ****** 2004 2 600 7 800 92 951 2004 15 000 232 200
2005 3 000 12 000 176 343 2005 28 000 433 440
2006 20 000 80 000 796 734 2006 20 000 309 600
Simon BeresfordWylie *** 2004 2 500 7 500 89 376 2004 00
2005 15 000 60 000 881 715 2005 35 000 541 800
2006 25 000 100 000 995 917 2006 25 000 387 000
Mary McDowell ********* 2004 12 500 37 500 446 879 2003 20 000 309 600
2005 15 000 60 000 881 715 2005 35 000 541 800
2006 25 000 100 000 995 917 2006 25 000 387 000
Hallstein Moerk ******** 2004 7 500 22 500 268 128 2004 20 000 309 600
2005 10 000 40 000 587 810 2005 25 000 387 000
2006 15 000 60 000 597 550 2006 15 000 232 200
Tero Ojanper¨a ********** 2004 2 500 7 500 89 376 2004 15 000 232 200
2005 10 000 40 000 587 810 2005 25 000 387 000
2006 15 000 60 000 597 550 2006 15 000 232 200
Niklas Savander ******** 2004 2 560 7 680 91 521 2004 16 500 255 420
2005 3 500 14 000 205 734 2005 25 000 387 000
2006 15 000 60 000 597 550 2006 15 000 232 200
Richard Simonson ****** 2004 12 500 37 500 446 879 2004 25 000 387 000
2005 15 000 60 000 881 715 2005 35 000 541 800
2006 25 000 100 000 995 917 2006 25 000 387 000
Veli Sundb¨ack ********** 2004 7 500 22 500 268 128 2004 20 000 309 600
2005 10 000 40 000 587 810 2005 25 000 387 000
2006 15 000 60 000 597 550 2006 15 000 232 200
Anssi Vanjoki ********** 2004 15 000 45 000 536 255 2004 35 000 541 800
2005 15 000 60 000 881 715 2005 35 000 541 800
2006 25 000 100 000 995 917 2006 25 000 387 000
Kai ¨
Oist¨am ¨o************ 2004 2 500 7 500 89 376 2004 15 000 232 200
2005 3 200 12 800 188 099 2005 25 000 387 000
2006 25 000 100 000 995 917 2006 25 000 387 000
Performance Shares and
Restricted Shares held
by the Group Executive
Board Total
(6)
******** 477 360 1 826 780 20 851 577 884 500 13 692 060
All outstanding
Performance Shares
and Restricted Shares
(Global plans), Total ** 12 311 989 45 798 454 554 183 057 5 985 476 92 655 168
(1) The performance period for the 2004 plan is 2004–2007, with one interim measurement period
for fiscal years 2004–2005. The performance period for the 2005 plan is 2005–2008, with one
interim measurement period for fiscal years 2005–2006. The performance period for the 2006
plan is 2006–2008, without any interim measurement period.
106