Nokia 2006 Annual Report Download - page 50
Download and view the complete annual report
Please find page 50 of the 2006 Nokia annual report below. You can navigate through the pages in the report by either clicking on the pages listed below, or by using the keyword search tool below to find specific information within the annual report.-
 1
1 -
2
-
3
-
4
-
5
-
6
-
7
-
8
-
9
-
10
-
11
-
12
-
13
-
14
-
15
-
16
-
17
-
18
-
19
-
20
-
21
-
22
-
23
-
24
-
25
-
26
-
27
-
28
-
29
-
30
-
31
-
32
-
33
-
34
-
35
-
36
-
37
-
38
-
39
-
 40
40 -
 41
41 -
 42
42 -
 43
43 -
 44
44 -
 45
45 -
 46
46 -
 47
47 -
 48
48 -
 49
49 -
 50
50 -
 51
51 -
 52
52 -
 53
53 -
 54
54 -
 55
55 -
 56
56 -
 57
57 -
 58
58 -
 59
59 -
 60
60 -
61
-
62
-
63
-
64
-
65
-
66
-
67
-
68
-
69
-
70
-
71
-
72
-
73
-
74
-
75
-
76
-
77
-
78
-
79
-
80
-
81
-
82
-
83
-
84
-
85
-
86
-
87
-
88
-
89
-
90
-
91
-
92
-
93
-
94
-
95
-
96
-
97
-
98
-
99
-
100
-
101
-
102
-
103
-
104
-
105
-
106
-
107
-
108
-
109
-
110
-
111
-
112
-
113
-
114
-
115
-
116
-
117
-
118
-
119
-
120
-
121
-
122
-
123
-
124
-
125
-
126
-
127
-
128
-
129
-
130
-
131
-
132
-
133
-
134
-
135
-
136
-
137
-
138
-
139
-
140
-
141
-
142
-
143
-
144
-
145
-
146
-
147
-
148
-
149
-
150
-
151
-
152
-
153
-
154
-
155
-
156
-
157
-
158
-
159
-
160
-
161
-
162
-
163
-
164
-
165
-
166
-
167
-
168
-
169
-
170
-
171
-
172
-
173
-
174
-
175
-
176
-
177
-
178
-
179
-
180
-
181
-
182
-
183
-
184
-
185
-
186
-
187
-
188
-
189
-
190
-
191
-
192
-
193
-
194
-
195
-
196
-
197
-
198
-
199
-
200
-
201
-
202
-
203
-
204
-
205
-
206
-
207
-
208
-
209
-
210
-
211
-
212
-
213
-
214
-
215
-
216
 |
 |
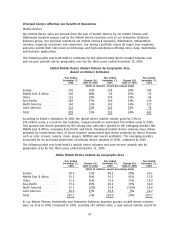
Nokia’s broad product portfolio allows it to serve all the relevant segments of the market. Quality is
extremely important to the consumer and Nokia believes that its quality is world class. Having high
quality products is important because it is a key determinant for consumer purchasing behavior and
also a critical element in managing costs effectively. Finally, of critical importance, is investing in
R&D to develop a healthy, broad, cost advantageous IPR portfolio.
Our device net sales are driven by factors such as the global mobile device market volumes, the
value of the mobile device market, Nokia market share development and Nokia ASPs.
The global mobile device market volume is driven by the number of new subscribers (net adds) and
the degree to which existing mobile subscribers replace their mobile devices with new devices. New
subscriber growth, particularly in emerging markets, is impacted primarily by lower cost of
ownership, driven by lower priced tariffs and lower cost mobile devices. The replacement market is
driven by the introduction of devices that are attractive to endusers in terms of design, features,
functionality and aesthetics. Nokia estimates that the replacement market will represent over 65% of
the device industry volumes in 2007, compared with over 60% in 2006. In 2007, we expect the most
important drivers of the replacement market will continue to be purchases of devices with color
screens, cameras, music players, WCDMA and other general aesthetics drivers. We also expect that
push email, mobile TV and navigation services will be significant drivers of the replacement market
in the future, but not in 2007. Replacement volumes in the emerging markets are having an
increasingly significant impact on the global market. In emerging markets, replacements accounted
for approximately 60% of total mobile device volumes in 2006, up from approximately 50% in 2005.
We are also seeing anecdotal evidence that some consumers in the emerging markets are upgrading
into higher priced devices when they replace their devices.
Industry volume growth is also influenced by, among other factors, regional economic factors;
regional political environment; consumer spending patterns; competitive pressures; regulatory
environments; the timing and success of product and service introductions by various market
participants, including mobile network operators; the commercial acceptance of new mobile devices,
technologies and services; and operators’ and distributors’ financial situations. Industry volumes are
also affected by the level of mobile device subsidies that mobile network operators are willing to
offer to end users in the markets where subsidies are prevalent.
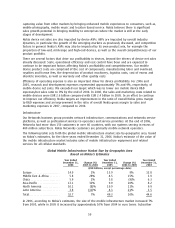
Nokia expects industry mobile device volumes in 2007 to grow by up to 10% from the approximately
978 million units Nokia estimates for 2006. We expect the volume growth in 2007 to be above 15%
in AsiaPacific, China, and Middle East & Africa, and below 10% in Europe, Latin America and North
America. Nokia forecasts that the three billion mobile subscriptions mark will be reached in 2007.
Nokia expects the device industry to experience value growth in 2007, but expects some decline in
industry ASPs, primarily reflecting the increasing impact of the emerging markets and competitive
factors in general.
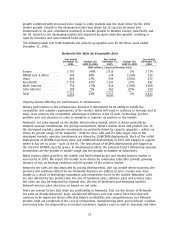
Nokia device net sales growth is impacted by Nokia market share development. Market share is
driven by our ability to have a competitive product portfolio with attractive aesthetics, design,
features and functionality for all major consumer segments and price points. Market share is also
impacted by our brand, quality, distribution, ability to deliver, competitive cost structure and how
we differentiate our products from those of our competitors. Nokia market share is also impacted by
the growth of our accessible market and mix of the global markets. In 2006, for example, Nokia
global device market share benefited from Nokia’s strong share in the fastest growing segments of
the global market, such as India, Middle and East Africa.
Nokia is targeting device market share gains in 2007. We believe that our global share should again
benefit in 2007 from our strong, leading position in the emerging markets, which is estimated to
again grow significantly faster in 2007 than the developed markets, and our strong position in the
fastest growing markets globally. Nokia market share in 2007 is also expected to benefit from our
strong share in the fastest growing technologies of GSM and WCDMA. GSM and WCDMA are estimated
to again grow significantly faster than CDMA in 2007. Nokia also sees sales growth opportunities in
49