Nokia 2006 Annual Report Download - page 63
Download and view the complete annual report
Please find page 63 of the 2006 Nokia annual report below. You can navigate through the pages in the report by either clicking on the pages listed below, or by using the keyword search tool below to find specific information within the annual report.-
 1
1 -
2
-
3
-
4
-
5
-
6
-
7
-
8
-
9
-
10
-
11
-
12
-
13
-
14
-
15
-
16
-
17
-
18
-
19
-
20
-
21
-
22
-
23
-
24
-
25
-
26
-
27
-
28
-
29
-
30
-
31
-
32
-
33
-
34
-
35
-
36
-
37
-
38
-
39
-
40
-
41
-
42
-
43
-
44
-
45
-
46
-
47
-
48
-
49
-
50
-
51
-
52
-
 53
53 -
 54
54 -
 55
55 -
 56
56 -
 57
57 -
 58
58 -
 59
59 -
 60
60 -
 61
61 -
 62
62 -
 63
63 -
 64
64 -
 65
65 -
 66
66 -
 67
67 -
 68
68 -
 69
69 -
 70
70 -
 71
71 -
 72
72 -
 73
73 -
74
-
75
-
76
-
77
-
78
-
79
-
80
-
81
-
82
-
83
-
84
-
85
-
86
-
87
-
88
-
89
-
90
-
91
-
92
-
93
-
94
-
95
-
96
-
97
-
98
-
99
-
100
-
101
-
102
-
103
-
104
-
105
-
106
-
107
-
108
-
109
-
110
-
111
-
112
-
113
-
114
-
115
-
116
-
117
-
118
-
119
-
120
-
121
-
122
-
123
-
124
-
125
-
126
-
127
-
128
-
129
-
130
-
131
-
132
-
133
-
134
-
135
-
136
-
137
-
138
-
139
-
140
-
141
-
142
-
143
-
144
-
145
-
146
-
147
-
148
-
149
-
150
-
151
-
152
-
153
-
154
-
155
-
156
-
157
-
158
-
159
-
160
-
161
-
162
-
163
-
164
-
165
-
166
-
167
-
168
-
169
-
170
-
171
-
172
-
173
-
174
-
175
-
176
-
177
-
178
-
179
-
180
-
181
-
182
-
183
-
184
-
185
-
186
-
187
-
188
-
189
-
190
-
191
-
192
-
193
-
194
-
195
-
196
-
197
-
198
-
199
-
200
-
201
-
202
-
203
-
204
-
205
-
206
-
207
-
208
-
209
-
210
-
211
-
212
-
213
-
214
-
215
-
216
 |
 |

in operating profit was driven by strong net sales and effective operating expense control. Operating
profit was negatively impacted by a lack of broad acceptance of certain highend products in our
portfolio.
Multimedia
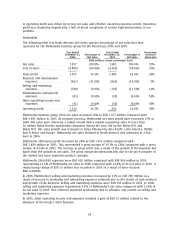
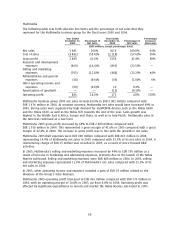
The following table sets forth selective line items and the percentage of net sales that they
represent for the Multimedia business group for the fiscal years 2006 and 2005.
Year Ended Year Ended Percentage
December 31, Percentage of December 31, Percentage of Increase/
2006 Net Sales 2005 Net Sales (Decrease)
(EUR millions, except percentage data)
Net sales ****************** 7 877 100.0% 5 981 100.0% 32%
Cost of sales *************** (4 800) (60.9)% (3 492) (58.4)% 37%
Gross profit **************** 3 077 39.1% 2 489 41.6% 24%
Research and development
expenses **************** (902) (11.5)% (860) (14.4)% 5%
Selling and marketing
expenses **************** (780) (9.9)% (705) (11.8)% 11%
Administrative and general
expenses **************** (45) (0.6)% (38) (0.6)% 18%
Other operating income and
expenses **************** (31) (0.4)% (50) (0.8)% 38%
Operating profit ************ 1 319 16.7% 836 14.0% 58%
Multimedia business group 2006 net sales increased 32% to EUR 7 877 million compared with
EUR 5 981 million in 2005. At constant currency, Multimedia net sales would have increased 27% in
2006. Net sales were driven by a robust overall device market supporting sales of more than
16 million Nokia Nseries multimedia computers during the year, led by the Nokia N70 and
Nokia N73. Net sales growth was strongest in China followed by AsiaPacific, Latin America, Middle
East & Africa and Europe. Multimedia net sales declined in North America and continued at a low
level in 2006.
Multimedia 2006 gross profit increased by 24% to EUR 3 077 million compared with
EUR 2 489 million in 2005. This represented a gross margin of 39.1% in 2006 compared with a gross
margin of 41.6% in 2005. The increase in gross profit was a result of the growth of the business but
lower than the growth in net sales. The gross margin declined primarily due to the price pressure in
the market and more expensive product concepts.
Multimedia 2006 R&D expenses were EUR 902 million compared with EUR 860 million in 2005,
representing 11.5% of Multimedia net sales in 2006 compared with 14.4% of its net sales in 2005. A
restructuring charge of EUR 15 million was recorded in 2005 as a result of more focused
R&D activities.
In 2006, Multimedia’s selling and marketing expenses increased by 11% to EUR 780 million as a
result of increase in marketing and advertising expenses primarily due to the launch of new products
and growth of the business. Selling and marketing expenses were EUR 705 million in 2005. In 2006,
selling and marketing expenses represented 9.9% of Multimedia’s net sales compared with 11.8% of
its net sales in 2005. This reflected improved productivity due to effective cost control on selling and
marketing expenses.
In 2005, other operating income and expenses included a gain of EUR 19 million related to the
divesture of the Group’s Tetra business.
62