Nokia 2006 Annual Report Download - page 202
Download and view the complete annual report
Please find page 202 of the 2006 Nokia annual report below. You can navigate through the pages in the report by either clicking on the pages listed below, or by using the keyword search tool below to find specific information within the annual report.-
 1
1 -
2
-
3
-
4
-
5
-
6
-
7
-
8
-
9
-
10
-
11
-
12
-
13
-
14
-
15
-
16
-
17
-
18
-
19
-
20
-
21
-
22
-
23
-
24
-
25
-
26
-
27
-
28
-
29
-
30
-
31
-
32
-
33
-
34
-
35
-
36
-
37
-
38
-
39
-
40
-
41
-
42
-
43
-
44
-
45
-
46
-
47
-
48
-
49
-
50
-
51
-
52
-
53
-
54
-
55
-
56
-
57
-
58
-
59
-
60
-
61
-
62
-
63
-
64
-
65
-
66
-
67
-
68
-
69
-
70
-
71
-
72
-
73
-
74
-
75
-
76
-
77
-
78
-
79
-
80
-
81
-
82
-
83
-
84
-
85
-
86
-
87
-
88
-
89
-
90
-
91
-
92
-
93
-
94
-
95
-
96
-
97
-
98
-
99
-
100
-
101
-
102
-
103
-
104
-
105
-
106
-
107
-
108
-
109
-
110
-
111
-
112
-
113
-
114
-
115
-
116
-
117
-
118
-
119
-
120
-
121
-
122
-
123
-
124
-
125
-
126
-
127
-
128
-
129
-
130
-
131
-
132
-
133
-
134
-
135
-
136
-
137
-
138
-
139
-
140
-
141
-
142
-
143
-
144
-
145
-
146
-
147
-
148
-
149
-
150
-
151
-
152
-
153
-
154
-
155
-
156
-
157
-
158
-
159
-
160
-
161
-
162
-
163
-
164
-
165
-
166
-
167
-
168
-
169
-
170
-
171
-
172
-
173
-
174
-
175
-
176
-
177
-
178
-
179
-
180
-
181
-
182
-
183
-
184
-
185
-
186
-
187
-
188
-
189
-
190
-
191
-
 192
192 -
 193
193 -
 194
194 -
 195
195 -
 196
196 -
 197
197 -
 198
198 -
 199
199 -
 200
200 -
 201
201 -
 202
202 -
 203
203 -
 204
204 -
 205
205 -
 206
206 -
 207
207 -
 208
208 -
 209
209 -
 210
210 -
 211
211 -
 212
212 -
213
-
214
-
215
-
216
 |
 |

Notes to the Consolidated Financial Statements (Continued)
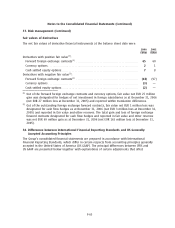
38. Differences between International Financial Reporting Standards and US Generally
Accepted Accounting Principles (Continued)
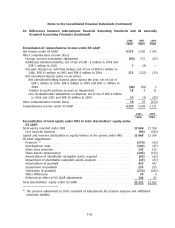
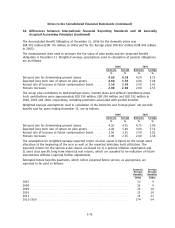
The following table reconciles the net pension asset recognized under IFRS with the net pension
liability recognized under US GAAP and reflects the impact of the adoption of FAS 158 as of
December 31, 2006:
2006
EURm
Net pension asset recognized for IFRS************************************************* 108
Difference in unrecognized amounts ************************************************** (53)
Additional minimum liability ********************************************************* (1)
Net pension asset recognized for US GAAP before adoption of FAS 158 ******************** 54
Adoption of FAS 158 **************************************************************** (222)
Net pension liability recognized for US GAAP after adoption of FAS 158 ******************* (168)
Development costs
Development costs are capitalized under IFRS after the product involved has reached a certain degree
of technical feasibility. Capitalization ceases and depreciation begins when the product becomes
available to customers. The depreciation period of these capitalized assets is between two and five
years.
Under US GAAP, software development costs are similarly capitalized after the product has reached a
certain degree of technological feasibility. However, certain nonsoftware related development costs
capitalized under IFRS are not capitalizable under US GAAP and therefore are expensed as incurred.
Under IFRS, whenever there is an indication that capitalized development costs may be impaired the
recoverable amount of the asset is estimated. An asset is impaired when the carrying amount of the
asset exceeds its recoverable amount. Recoverable amount is defined as the higher of an asset’s net
selling price and value in use. Value in use is the present value of estimated discounted future cash
flows expected to arise from the continuing use of an asset and from its disposal at the end of its
useful life.
Under US GAAP, the unamortized capitalized costs of a software product are compared at each
balance sheet date to the net realizable value of that product with any excess written off. Net
realizable value is defined as the estimated future gross revenues from that product reduced by the
estimated future costs of completing and disposing of that product, including the costs of
performing maintenance and customer support required to satisfy the enterprise’s responsibility set
forth at the time of sale.
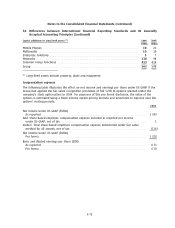
The amount of unamortized capitalized software development costs under US GAAP is
EUR 149 million in 2006 (EUR 213 million in 2005).
The US GAAP development cost adjustment reflects the reversal of capitalized nonsoftware related
development costs under US GAAP net of the reversal of associated amortization expense and
impairments under IFRS. The adjustment also reflects differences in impairment methodologies under
IFRS and US GAAP for the determination of the recoverable amount and net realizable value of
software related development costs.
Sharebased compensation
The Group maintains several sharebased employee compensation plans, which are described more
fully in Note 23. Under IFRS, the Group accounts for equity instruments under IFRS 2 which was
F67