Nokia 2006 Annual Report Download - page 65
Download and view the complete annual report
Please find page 65 of the 2006 Nokia annual report below. You can navigate through the pages in the report by either clicking on the pages listed below, or by using the keyword search tool below to find specific information within the annual report.-
 1
1 -
2
-
3
-
4
-
5
-
6
-
7
-
8
-
9
-
10
-
11
-
12
-
13
-
14
-
15
-
16
-
17
-
18
-
19
-
20
-
21
-
22
-
23
-
24
-
25
-
26
-
27
-
28
-
29
-
30
-
31
-
32
-
33
-
34
-
35
-
36
-
37
-
38
-
39
-
40
-
41
-
42
-
43
-
44
-
45
-
46
-
47
-
48
-
49
-
50
-
51
-
52
-
53
-
54
-
 55
55 -
 56
56 -
 57
57 -
 58
58 -
 59
59 -
 60
60 -
 61
61 -
 62
62 -
 63
63 -
 64
64 -
 65
65 -
 66
66 -
 67
67 -
 68
68 -
 69
69 -
 70
70 -
 71
71 -
 72
72 -
 73
73 -
 74
74 -
 75
75 -
76
-
77
-
78
-
79
-
80
-
81
-
82
-
83
-
84
-
85
-
86
-
87
-
88
-
89
-
90
-
91
-
92
-
93
-
94
-
95
-
96
-
97
-
98
-
99
-
100
-
101
-
102
-
103
-
104
-
105
-
106
-
107
-
108
-
109
-
110
-
111
-
112
-
113
-
114
-
115
-
116
-
117
-
118
-
119
-
120
-
121
-
122
-
123
-
124
-
125
-
126
-
127
-
128
-
129
-
130
-
131
-
132
-
133
-
134
-
135
-
136
-
137
-
138
-
139
-
140
-
141
-
142
-
143
-
144
-
145
-
146
-
147
-
148
-
149
-
150
-
151
-
152
-
153
-
154
-
155
-
156
-
157
-
158
-
159
-
160
-
161
-
162
-
163
-
164
-
165
-
166
-
167
-
168
-
169
-
170
-
171
-
172
-
173
-
174
-
175
-
176
-
177
-
178
-
179
-
180
-
181
-
182
-
183
-
184
-
185
-
186
-
187
-
188
-
189
-
190
-
191
-
192
-
193
-
194
-
195
-
196
-
197
-
198
-
199
-
200
-
201
-
202
-
203
-
204
-
205
-
206
-
207
-
208
-
209
-
210
-
211
-
212
-
213
-
214
-
215
-
216
 |
 |

Networks
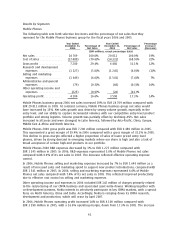
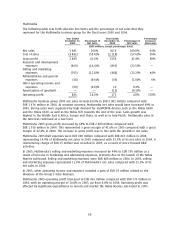
The following table sets forth selective line items and the percentage of net sales that they
represent for the Networks business group for the fiscal years 2006 and 2005.
Year Ended Year Ended Percentage
December 31, Percentage of December 31, Percentage of Increase/
2006 Net Sales 2005 Net Sales (Decrease)
(EUR millions, except percentage data)
Net sales ****************** 7 453 100.0% 6 557 100.0% 14%
Cost of Sales *************** (4 910) (65.9)% (3 967) (60.5)% 24%
Gross profit **************** 2 543 34.1% 2 590 39.5% (2)%
Research and development
expenses **************** (1 180) (15.8)% (1 170) (17.8)% 1%
Selling and marketing
expenses **************** (544) (7.3)% (475) (7.3)% 15%
Administrative and general
expenses **************** (245) (3.3)% (211) (3.2)% 16%
Other income and expenses** 234 3.1% 121 1.8% 93%
Operating profit ************ 808 10.8% 855 13.0% (5)%
Networks business group 2006 net sales increased 14% to EUR 7 453 million compared with
EUR 6 557 million in 2005. At constant currency, Networks business group net sales would have
increased 12% in 2006. Strong net sales growth in Middle East & Africa, AsiaPacific, China and Latin
America was partially offset by net sales decline in North America and Europe. Net sales growth for
Networks was especially strong in the emerging markets, like India, where the market continued its
robust growth and where Nokia estimates it gained market share.
In Networks, gross profit decreased by 2% to EUR 2 543 million, compared with EUR 2 590 million in
2005, primarily due to pricing pressure and our ongoing push into markets where, historically, we
have not had a presence as well as investments in the growing network services market, which
generally has lower gross margins than equipment sales. This represented a gross margin of 34.1%
in 2006 compared with a gross margin of 39.5% in 2005.
In Networks, R&D expenses increased 1% to EUR 1 180 million compared with EUR 1 170 million in
2005. In 2006, R&D expenses represented 15.8% of Networks net sales compared with 17.8% in
2005.
In 2006, Networks selling and marketing expenses increased by 15% to EUR 544 million compared
with EUR 475 million in 2005 in line with the overall net sales growth. Selling and marketing
expenses represented 7.3% of Networks net sales in 2006 and 2005.
In 2006, other operating income included a gain of EUR 276 million representing our share of the
proceeds from the Telsim sale. In 2005, other operating income and expenses included a gain of
EUR 42 million related to the divesture of the Group’s Tetra business and EUR 18 million gain related
to the partial sale of a minority investment.
Networks 2006 operating profit decreased to EUR 808 million from EUR 855 million in 2005.
Networks operating profit included the negative impact of EUR 39 million incremental costs related
to Nokia Siemens Networks. The business group’s operating margin for 2006 was 10.8% compared
with 13.0% in 2005. The lower operating profit primarily reflected pricing pressure and our efforts to
gain market share, a greater proportion of sales from the emerging markets and a higher share of
service sales.
64