Nokia 2006 Annual Report Download - page 60
Download and view the complete annual report
Please find page 60 of the 2006 Nokia annual report below. You can navigate through the pages in the report by either clicking on the pages listed below, or by using the keyword search tool below to find specific information within the annual report.-
 1
1 -
2
-
3
-
4
-
5
-
6
-
7
-
8
-
9
-
10
-
11
-
12
-
13
-
14
-
15
-
16
-
17
-
18
-
19
-
20
-
21
-
22
-
23
-
24
-
25
-
26
-
27
-
28
-
29
-
30
-
31
-
32
-
33
-
34
-
35
-
36
-
37
-
38
-
39
-
40
-
41
-
42
-
43
-
44
-
45
-
46
-
47
-
48
-
49
-
 50
50 -
 51
51 -
 52
52 -
 53
53 -
 54
54 -
 55
55 -
 56
56 -
 57
57 -
 58
58 -
 59
59 -
 60
60 -
 61
61 -
 62
62 -
 63
63 -
 64
64 -
 65
65 -
 66
66 -
 67
67 -
 68
68 -
 69
69 -
 70
70 -
71
-
72
-
73
-
74
-
75
-
76
-
77
-
78
-
79
-
80
-
81
-
82
-
83
-
84
-
85
-
86
-
87
-
88
-
89
-
90
-
91
-
92
-
93
-
94
-
95
-
96
-
97
-
98
-
99
-
100
-
101
-
102
-
103
-
104
-
105
-
106
-
107
-
108
-
109
-
110
-
111
-
112
-
113
-
114
-
115
-
116
-
117
-
118
-
119
-
120
-
121
-
122
-
123
-
124
-
125
-
126
-
127
-
128
-
129
-
130
-
131
-
132
-
133
-
134
-
135
-
136
-
137
-
138
-
139
-
140
-
141
-
142
-
143
-
144
-
145
-
146
-
147
-
148
-
149
-
150
-
151
-
152
-
153
-
154
-
155
-
156
-
157
-
158
-
159
-
160
-
161
-
162
-
163
-
164
-
165
-
166
-
167
-
168
-
169
-
170
-
171
-
172
-
173
-
174
-
175
-
176
-
177
-
178
-
179
-
180
-
181
-
182
-
183
-
184
-
185
-
186
-
187
-
188
-
189
-
190
-
191
-
192
-
193
-
194
-
195
-
196
-
197
-
198
-
199
-
200
-
201
-
202
-
203
-
204
-
205
-
206
-
207
-
208
-
209
-
210
-
211
-
212
-
213
-
214
-
215
-
216
 |
 |

options available on Nokia shares in the open market and in light of historical patterns of volatility.
These variables make estimation of fair value of stock options difficult.
Nonmarket vesting conditions attached to the performance shares are included in assumptions
about the number of shares that the employee will ultimately receive relating to projections of sales
and earnings per share. On a regular basis we review the assumptions made and revise the
estimates of the number of performance shares that are expected to be settled, where necessary. At
the date of grant the number of performance shares granted to employees that are expected to be
settled is assumed to be the target amount. Any subsequent revisions to the estimates of the
number of performance shares expected to be settled may increase or decrease total compensation
expense. Such increase or decrease adjusts the prior period compensation expense in the period of
the review on a cumulative basis for unvested performance shares for which compensation expense
has already been recognized in the profit and loss account, and in subsequent periods for unvested
performance shares for which the expense has not yet been recognized in the profit and loss
account. Significant differences in employee option activity, equity market performance and our
projected and actual sales and earnings per share performance may materially affect future expense.
In addition, the value, if any, an employee ultimately receives from sharebased payment awards
may not correspond to the expense amounts recorded by the Group.
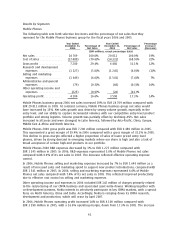
Results of Operations
2006 compared with 2005
Nokia Group
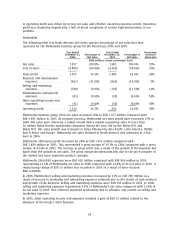
The following table sets forth selective line items and the percentage of net sales that they
represent for Nokia for the fiscal years 2006 and 2005.
Year Ended Year Ended Percentage
December 31, Percentage of December 31, Percentage of Increase/
2006 Net Sales 2005 Net Sales (Decrease)
(EUR millions, except percentage data)
Net sales ****************** 41 121 100% 34 191 100.0% 20%
Cost of sales *************** (27 742) (67.5)% (22 209) (65.0)% 25%
Gross profit **************** 13 379 32.5% 11 982 35.0% 12%
Research and development
expenses **************** (3 897) (9.5)% (3 825) (11.2)% 2%
Selling and marketing
expenses **************** (3 314) (8.1)% (2 961) (8.7)% 12%
Administrative and general
expenses **************** (666) (1.6)% (609) (1.8)% 9%
Other operating income and
expenses **************** (14) 52 0.2%
Operating profit ************ 5 488 13.3% 4 639 13.6% 18%
For 2006, Nokia’s net sales increased 20% to EUR 41.1 billion compared with EUR 34.2 billion in
2005. At constant currency, group net sales would have grown 17% in 2006. Our gross margin in
2006 was 32.5% compared with 35.0% in 2005. This lower gross margin primarily reflected the
inability of certain highend products in our portfolio to compete effectively in various markets,
coupled with a general shift to lower priced products driven primarily by the growth of emerging
markets and our strong position in those markets. Gross margin was also negatively impacted by a
decline in Networks’ gross margin, which was primarily affected by pricing pressure and our efforts
to gain market share, a greater proportion of sales from emerging markets and a higher share of
service sales.
59