Nokia 2006 Annual Report Download - page 52
Download and view the complete annual report
Please find page 52 of the 2006 Nokia annual report below. You can navigate through the pages in the report by either clicking on the pages listed below, or by using the keyword search tool below to find specific information within the annual report.-
 1
1 -
2
-
3
-
4
-
5
-
6
-
7
-
8
-
9
-
10
-
11
-
12
-
13
-
14
-
15
-
16
-
17
-
18
-
19
-
20
-
21
-
22
-
23
-
24
-
25
-
26
-
27
-
28
-
29
-
30
-
31
-
32
-
33
-
34
-
35
-
36
-
37
-
38
-
39
-
40
-
41
-
 42
42 -
 43
43 -
 44
44 -
 45
45 -
 46
46 -
 47
47 -
 48
48 -
 49
49 -
 50
50 -
 51
51 -
 52
52 -
 53
53 -
 54
54 -
 55
55 -
 56
56 -
 57
57 -
 58
58 -
 59
59 -
 60
60 -
 61
61 -
 62
62 -
63
-
64
-
65
-
66
-
67
-
68
-
69
-
70
-
71
-
72
-
73
-
74
-
75
-
76
-
77
-
78
-
79
-
80
-
81
-
82
-
83
-
84
-
85
-
86
-
87
-
88
-
89
-
90
-
91
-
92
-
93
-
94
-
95
-
96
-
97
-
98
-
99
-
100
-
101
-
102
-
103
-
104
-
105
-
106
-
107
-
108
-
109
-
110
-
111
-
112
-
113
-
114
-
115
-
116
-
117
-
118
-
119
-
120
-
121
-
122
-
123
-
124
-
125
-
126
-
127
-
128
-
129
-
130
-
131
-
132
-
133
-
134
-
135
-
136
-
137
-
138
-
139
-
140
-
141
-
142
-
143
-
144
-
145
-
146
-
147
-
148
-
149
-
150
-
151
-
152
-
153
-
154
-
155
-
156
-
157
-
158
-
159
-
160
-
161
-
162
-
163
-
164
-
165
-
166
-
167
-
168
-
169
-
170
-
171
-
172
-
173
-
174
-
175
-
176
-
177
-
178
-
179
-
180
-
181
-
182
-
183
-
184
-
185
-
186
-
187
-
188
-
189
-
190
-
191
-
192
-
193
-
194
-
195
-
196
-
197
-
198
-
199
-
200
-
201
-
202
-
203
-
204
-
205
-
206
-
207
-
208
-
209
-
210
-
211
-
212
-
213
-
214
-
215
-
216
 |
 |

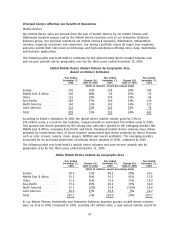
growth combined with increased voice usage in some markets was the main driver for the 2006
market growth. Growth in the developed market was driven by 2G capacity increases and
investments in 3G also contributed positively to market growth in Western Europe, AsiaPacific and
the US. Growth in the developing market was impacted by rapid subscriber growth, resulting in
capacity increases and new network build outs.
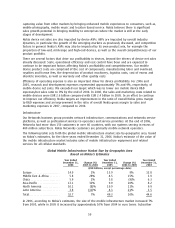
The following table sets forth Networks net sales by geographic area for the three years ended
December 31, 2006.
Networks Net Sales by Geographic Area
Year ended Year Ended Year Ended
December 31, Change (%) December 31, Change (%) December 31,
2006 2005 to 2006 2005 2004 to 2005 2004
(EUR millions, except percentage data)
Europe ******************* 2 707 (4)% 2 813 1% 2 774
Middle East & Africa ******* 546 99% 274 (13)% 316
China ******************** 885 27% 695 (20)% 872
AsiaPacific *************** 1 758 47% 1 197 27% 942
North America ************ 758 (7)% 816 (19)% 1 008
Latin America ************* 799 5% 762 47% 520
Total********************* 7 453 14% 6 557 2% 6 432
Ongoing factors affecting our performance in infrastructure
Nokia’s performance in the infrastructure business is determined by its ability to satisfy the
competitive and complex requirements of the market. Nokia will need to continue to leverage and in
some cases improve the competitive advantages it believes it has of scale, technology, product
portfolio and cost structure in order to maintain or improve its position in the market.
Networks’ net sales depend on the mobile infrastructure market, which is driven primarily by
network operator investments, the pricing environment, Nokia’s market share and product mix. In
the developed markets, operator investments are primarily driven by capacity upgrades – which are
driven by greater usage of the networks – both for voice calls and for data usage. Also in the
developed markets, operator investments are driven by 3G/WCDMA deployments. Much of the initial
deployments of WCDMA have been done and additional deployments in 2007 will happen in regions
where it has yet to occur – such as the US. The next phase of WCDMA deployments will happen as
the need for WCMDA capacity grows. In developing markets, the principal factors influencing operator
investments are the growth in mobile usage and the growth in number of subscribers.
Nokia expects slight growth in the mobile and fixed infrastructure and related services market in
euro terms in 2007. We expect the market to be driven by continuing subscriber growth, growing
minutes of use, technology evolution and the growth of the services market.
Networks net sales are also impacted by pricing developments. Like our mobile device business, the
products and solutions offered by our Networks business are subject to price erosion over time,
largely as a result of technology maturation and competitive forces in the market. Networks’ sales
are also affected by the product mix, the mix of hardware sales, software sales and services sales.
Net sales can also be impacted by regional mix, the mix of developed and emerging markets.
Network services sales also have an impact on net sales.
There are several factors that drive our profitability in Networks. First are the drivers of Networks
net sales as already discussed. Scale, operational efficiency and cost control have been and will
continue to be important factors affecting Nokia’s profitability and competitiveness. Our Network
product costs are comprised of the cost of components, manufacturing labor and overhead, royalties
and license fees, the depreciation of product machinery, logistics costs as well as warranty and other
51