Nokia 2006 Annual Report Download - page 159
Download and view the complete annual report
Please find page 159 of the 2006 Nokia annual report below. You can navigate through the pages in the report by either clicking on the pages listed below, or by using the keyword search tool below to find specific information within the annual report.-
 1
1 -
2
-
3
-
4
-
5
-
6
-
7
-
8
-
9
-
10
-
11
-
12
-
13
-
14
-
15
-
16
-
17
-
18
-
19
-
20
-
21
-
22
-
23
-
24
-
25
-
26
-
27
-
28
-
29
-
30
-
31
-
32
-
33
-
34
-
35
-
36
-
37
-
38
-
39
-
40
-
41
-
42
-
43
-
44
-
45
-
46
-
47
-
48
-
49
-
50
-
51
-
52
-
53
-
54
-
55
-
56
-
57
-
58
-
59
-
60
-
61
-
62
-
63
-
64
-
65
-
66
-
67
-
68
-
69
-
70
-
71
-
72
-
73
-
74
-
75
-
76
-
77
-
78
-
79
-
80
-
81
-
82
-
83
-
84
-
85
-
86
-
87
-
88
-
89
-
90
-
91
-
92
-
93
-
94
-
95
-
96
-
97
-
98
-
99
-
100
-
101
-
102
-
103
-
104
-
105
-
106
-
107
-
108
-
109
-
110
-
111
-
112
-
113
-
114
-
115
-
116
-
117
-
118
-
119
-
120
-
121
-
122
-
123
-
124
-
125
-
126
-
127
-
128
-
129
-
130
-
131
-
132
-
133
-
134
-
135
-
136
-
137
-
138
-
139
-
140
-
141
-
142
-
143
-
144
-
145
-
146
-
147
-
148
-
 149
149 -
 150
150 -
 151
151 -
 152
152 -
 153
153 -
 154
154 -
 155
155 -
 156
156 -
 157
157 -
 158
158 -
 159
159 -
 160
160 -
 161
161 -
 162
162 -
 163
163 -
 164
164 -
 165
165 -
 166
166 -
 167
167 -
 168
168 -
 169
169 -
170
-
171
-
172
-
173
-
174
-
175
-
176
-
177
-
178
-
179
-
180
-
181
-
182
-
183
-
184
-
185
-
186
-
187
-
188
-
189
-
190
-
191
-
192
-
193
-
194
-
195
-
196
-
197
-
198
-
199
-
200
-
201
-
202
-
203
-
204
-
205
-
206
-
207
-
208
-
209
-
210
-
211
-
212
-
213
-
214
-
215
-
216
 |
 |

Notes to the Consolidated Financial Statements (Continued)
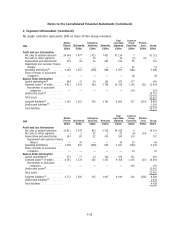
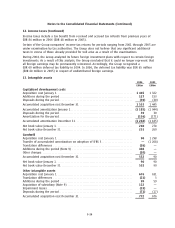
2. Segment information (Continued)
Total Common
Mobile Enterprise reportable Group Elimina-
Phones Multimedia Solutions Networks segments Functions tions Group
2004
EURm EURm EURm EURm EURm EURm EURm EURm
Profit and Loss Information
Net sales to external customers *****18 443 3 653 815 6 431 29 342 29 29 371
Net sales to other segments ******* 78 23 24 — 125 (29) (96) —
Depreciation and amortization ***** 306 77 23 314 720 148 868
Impairment and customer finance
charges *********************** — — — 115 115 11 126
Operating profit/(loss) ************ 3 786 175 (210) 884 4 635 (309) 4 326
Share of results of associated
companies********************* — — — — — (26) (26)
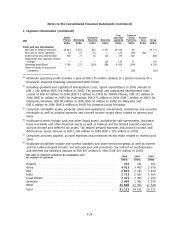
(1) Networks operating profit includes a gain of EUR 276 million relating to a partial recovery of a
previously impaired financing arrangement with Telsim.
(2) Including goodwill and capitalized development costs, capital expenditures in 2006 amount to
EUR 1 240 million (EUR 760 million in 2005). The goodwill and capitalized development costs
consist of EUR 60 million in 2006 (EUR 31 million in 2005) for Mobile Phones, EUR 171 million in
2006 (EUR 16 million in 2005) for Multimedia, EUR 271 million in 2006 (EUR 5 million in 2005) for
Enterprise Solutions, EUR 88 million in 2006 (EUR 93 million in 2005) for Networks and
EUR 0 million in 2006 (EUR 8 million in 2005) for Common Group Functions.
(3) Comprises intangible assets, property, plant and equipment, investments, inventories and accounts
receivable as well as prepaid expenses and accrued income except those related to interest and
taxes.
(4) Unallocated assets include cash and other liquid assets, availableforsale investments, longterm
loans receivable and other financial assets as well as interest and tax related prepaid expenses,
accrued income and deferred tax assets. Tax related prepaid expenses and accrued income, and
deferred tax assets amount to EUR 1 240 million in 2006 (EUR 1 281 million in 2005).
(5) Comprises accounts payable, accrued expenses and provisions except those related to interest and
taxes.
(6) Unallocated liabilities include noncurrent liabilities and shortterm borrowings as well as interest
and tax related prepaid income, accrued expenses and provisions. Tax related accrued expenses
and deferred tax liabilities amount to EUR 497 million in 2006 (EUR 433 million in 2005).
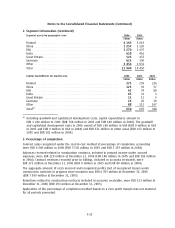
Net sales to external customers by geographic area 2006 2005 2004
by location of customer
EURm EURm EURm
Finland ****************************************************** 387 331 351
China ******************************************************** 4 913 3 403 2 678
USA ********************************************************* 2 815 2 743 3 430
India ******************************************************** 2 713 2 022 1 369
Great Britain ************************************************* 2 425 2 405 2 269
Germany ***************************************************** 2 060 1 982 1 730
Other******************************************************** 25 808 21 305 17 544
Total ******************************************************** 41 121 34 191 29 371
F24