Nokia 2006 Annual Report Download - page 199
Download and view the complete annual report
Please find page 199 of the 2006 Nokia annual report below. You can navigate through the pages in the report by either clicking on the pages listed below, or by using the keyword search tool below to find specific information within the annual report.-
 1
1 -
2
-
3
-
4
-
5
-
6
-
7
-
8
-
9
-
10
-
11
-
12
-
13
-
14
-
15
-
16
-
17
-
18
-
19
-
20
-
21
-
22
-
23
-
24
-
25
-
26
-
27
-
28
-
29
-
30
-
31
-
32
-
33
-
34
-
35
-
36
-
37
-
38
-
39
-
40
-
41
-
42
-
43
-
44
-
45
-
46
-
47
-
48
-
49
-
50
-
51
-
52
-
53
-
54
-
55
-
56
-
57
-
58
-
59
-
60
-
61
-
62
-
63
-
64
-
65
-
66
-
67
-
68
-
69
-
70
-
71
-
72
-
73
-
74
-
75
-
76
-
77
-
78
-
79
-
80
-
81
-
82
-
83
-
84
-
85
-
86
-
87
-
88
-
89
-
90
-
91
-
92
-
93
-
94
-
95
-
96
-
97
-
98
-
99
-
100
-
101
-
102
-
103
-
104
-
105
-
106
-
107
-
108
-
109
-
110
-
111
-
112
-
113
-
114
-
115
-
116
-
117
-
118
-
119
-
120
-
121
-
122
-
123
-
124
-
125
-
126
-
127
-
128
-
129
-
130
-
131
-
132
-
133
-
134
-
135
-
136
-
137
-
138
-
139
-
140
-
141
-
142
-
143
-
144
-
145
-
146
-
147
-
148
-
149
-
150
-
151
-
152
-
153
-
154
-
155
-
156
-
157
-
158
-
159
-
160
-
161
-
162
-
163
-
164
-
165
-
166
-
167
-
168
-
169
-
170
-
171
-
172
-
173
-
174
-
175
-
176
-
177
-
178
-
179
-
180
-
181
-
182
-
183
-
184
-
185
-
186
-
187
-
188
-
 189
189 -
 190
190 -
 191
191 -
 192
192 -
 193
193 -
 194
194 -
 195
195 -
 196
196 -
 197
197 -
 198
198 -
 199
199 -
 200
200 -
 201
201 -
 202
202 -
 203
203 -
 204
204 -
 205
205 -
 206
206 -
 207
207 -
 208
208 -
 209
209 -
210
-
211
-
212
-
213
-
214
-
215
-
216
 |
 |

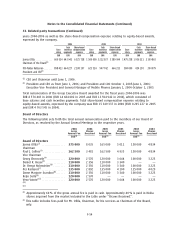
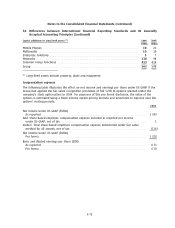
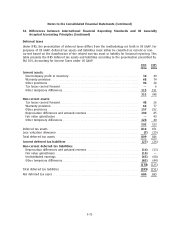
Notes to the Consolidated Financial Statements (Continued)
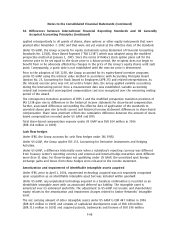
38. Differences between International Financial Reporting Standards and US Generally
Accepted Accounting Principles (Continued)
consolidated net income and total shareholders’ equity under US GAAP as of and for the years ended
December 31:
2006 2005 2004
EURm EURm EURm
Reconciliation of profit attributable to equity holders of the parent
under IFRS to net income under US GAAP:
Profit attributable to equity holders of the parent reported under IFRS***** 4 306 3 616 3 192
US GAAP adjustments:
Pensions ********************************************************** (1) (3) —
Development costs ************************************************* (55) 10 42
Sharebased compensation expense ********************************** (8) (39) 39
Cash flow hedges ************************************************** —(12) 31
Amortization of identifiable intangible assets acquired ***************** —— (11)
Impairment of identifiable intangible assets acquired ****************** —— (47)
Amortization of goodwill ******************************************* —— 106
Other differences*************************************************** 22 (1) (6)
Deferred tax effect of US GAAP adjustments *************************** 11 11 (3)
Net income under US GAAP ****************************************** 4 275 3 582 3 343
Earnings per share under US GAAP:
2006 2005 2004
EUR EUR EUR
Earnings per share (net income):
Basic************************************************** 1.05 0.82 0.73
Diluted************************************************ 1.05 0.82 0.73
Average number of shares (000’s shares):
Basic************************************************** 4 062 833 4 365 547 4 593 196
Diluted************************************************ 4 086 529 4 371 239 4 600 337
F64