Nokia 2006 Annual Report Download - page 75
Download and view the complete annual report
Please find page 75 of the 2006 Nokia annual report below. You can navigate through the pages in the report by either clicking on the pages listed below, or by using the keyword search tool below to find specific information within the annual report.-
 1
1 -
2
-
3
-
4
-
5
-
6
-
7
-
8
-
9
-
10
-
11
-
12
-
13
-
14
-
15
-
16
-
17
-
18
-
19
-
20
-
21
-
22
-
23
-
24
-
25
-
26
-
27
-
28
-
29
-
30
-
31
-
32
-
33
-
34
-
35
-
36
-
37
-
38
-
39
-
40
-
41
-
42
-
43
-
44
-
45
-
46
-
47
-
48
-
49
-
50
-
51
-
52
-
53
-
54
-
55
-
56
-
57
-
58
-
59
-
60
-
61
-
62
-
63
-
64
-
 65
65 -
 66
66 -
 67
67 -
 68
68 -
 69
69 -
 70
70 -
 71
71 -
 72
72 -
 73
73 -
 74
74 -
 75
75 -
 76
76 -
 77
77 -
 78
78 -
 79
79 -
 80
80 -
 81
81 -
 82
82 -
 83
83 -
 84
84 -
 85
85 -
86
-
87
-
88
-
89
-
90
-
91
-
92
-
93
-
94
-
95
-
96
-
97
-
98
-
99
-
100
-
101
-
102
-
103
-
104
-
105
-
106
-
107
-
108
-
109
-
110
-
111
-
112
-
113
-
114
-
115
-
116
-
117
-
118
-
119
-
120
-
121
-
122
-
123
-
124
-
125
-
126
-
127
-
128
-
129
-
130
-
131
-
132
-
133
-
134
-
135
-
136
-
137
-
138
-
139
-
140
-
141
-
142
-
143
-
144
-
145
-
146
-
147
-
148
-
149
-
150
-
151
-
152
-
153
-
154
-
155
-
156
-
157
-
158
-
159
-
160
-
161
-
162
-
163
-
164
-
165
-
166
-
167
-
168
-
169
-
170
-
171
-
172
-
173
-
174
-
175
-
176
-
177
-
178
-
179
-
180
-
181
-
182
-
183
-
184
-
185
-
186
-
187
-
188
-
189
-
190
-
191
-
192
-
193
-
194
-
195
-
196
-
197
-
198
-
199
-
200
-
201
-
202
-
203
-
204
-
205
-
206
-
207
-
208
-
209
-
210
-
211
-
212
-
213
-
214
-
215
-
216
 |
 |
per share paid per share for the years ended December 31, 2005 and 2004, respectively. See
‘‘Item 3.A Selected Financial Data—Distribution of Earnings.’’
Nokia has no potentially significant refinancing requirements in 2007. Nokia expects to incur
additional indebtedness from time to time as required to finance working capital needs. At
December 31, 2006, Nokia had a USD 500 million US Commercial Paper, or USCP, program and a
USD 500 million Euro Commercial Paper, or ECP, program. In addition, at the same date, Nokia had a
Finnish local commercial paper program totaling EUR 750 million. At December 31, 2006, we also had
a committed credit facility of USD 2 000 million and a number of shortterm uncommitted facilities.
For further information regarding our shortterm borrowings, including the average interest rate, see
Note 27 to our consolidated financial statements included in Item 18 of this annual report on
Form 20F.
Nokia has historically maintained a high level of liquid assets. Management estimates that the cash
and other liquid assets level of EUR 8 537 million at the end of 2006, together with Nokia’s available
credit facilities, cash flow from operations, funds available from longterm and shortterm debt
financings, as well as the proceeds of future equity or convertible bond offerings, will be sufficient
to satisfy our future working capital needs, capital expenditure, research and development and debt
service requirements at least through 2007. The ratings of our short and longterm debt from credit
rating agencies have not changed during the year. The ratings at December 31, 2006, were:
Shortterm Standard & Poor’s A1
Moody’s P1
Longterm Standard & Poor’s A
Moody’s A1
We believe that Nokia will continue to be able to access the capital markets on terms and in
amounts that will be satisfactory to us, and that we will be able to obtain bid and performance
bonds, to arrange or provide customer financing as necessary to support our business and to engage
in hedging transactions on commercially acceptable terms.
Nokia is not a capital intensive company in terms of fixed assets, but rather invests in research and
development, marketing and building the Nokia brand. In 2006, capital expenditures totaled EUR
650 million compared with EUR 607 million in 2005 and EUR 548 million 2004. The increase in 2006
resulted from increased amount of capital expenditures in machinery and equipment to support the
company’s growing volumes. Principal capital expenditures during the three years included
production lines, test equipment and computer hardware used primarily in research and
development as well as office and manufacturing facilities. We expect the amount of capital
expenditures during 2007 to be approximately EUR 700 million, and to be funded from our cash flow
from operations. This estimate for 2007 does not include the full impact of Nokia Siemens Networks.
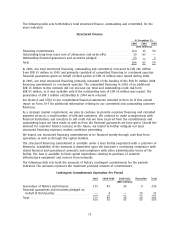
Structured Finance
Structured Finance includes customer financing and other third party financing. Network operators in
some markets sometimes require their suppliers, including us, to arrange or provide longterm
financing as a condition to obtaining or bidding on infrastructure projects. Customer financing
continues to be requested by some operators in some markets. Extended payment terms may
continue to result in a material aggregate amount of trade credits, but the associated risk is
mitigated by the fact that the portfolio relates to a variety of customers. See ‘‘Item 3.D Risk
Factors—Providing customer financing or extending payment terms to customers can be a
competitive requirement and could adversely and materially affect our results of operations, financial
condition and cash flow.’’
74