Nokia 2006 Annual Report Download - page 142
Download and view the complete annual report
Please find page 142 of the 2006 Nokia annual report below. You can navigate through the pages in the report by either clicking on the pages listed below, or by using the keyword search tool below to find specific information within the annual report.-
 1
1 -
2
-
3
-
4
-
5
-
6
-
7
-
8
-
9
-
10
-
11
-
12
-
13
-
14
-
15
-
16
-
17
-
18
-
19
-
20
-
21
-
22
-
23
-
24
-
25
-
26
-
27
-
28
-
29
-
30
-
31
-
32
-
33
-
34
-
35
-
36
-
37
-
38
-
39
-
40
-
41
-
42
-
43
-
44
-
45
-
46
-
47
-
48
-
49
-
50
-
51
-
52
-
53
-
54
-
55
-
56
-
57
-
58
-
59
-
60
-
61
-
62
-
63
-
64
-
65
-
66
-
67
-
68
-
69
-
70
-
71
-
72
-
73
-
74
-
75
-
76
-
77
-
78
-
79
-
80
-
81
-
82
-
83
-
84
-
85
-
86
-
87
-
88
-
89
-
90
-
91
-
92
-
93
-
94
-
95
-
96
-
97
-
98
-
99
-
100
-
101
-
102
-
103
-
104
-
105
-
106
-
107
-
108
-
109
-
110
-
111
-
112
-
113
-
114
-
115
-
116
-
117
-
118
-
119
-
120
-
121
-
122
-
123
-
124
-
125
-
126
-
127
-
128
-
129
-
130
-
131
-
 132
132 -
 133
133 -
 134
134 -
 135
135 -
 136
136 -
 137
137 -
 138
138 -
 139
139 -
 140
140 -
 141
141 -
 142
142 -
 143
143 -
 144
144 -
 145
145 -
 146
146 -
 147
147 -
 148
148 -
 149
149 -
 150
150 -
 151
151 -
 152
152 -
153
-
154
-
155
-
156
-
157
-
158
-
159
-
160
-
161
-
162
-
163
-
164
-
165
-
166
-
167
-
168
-
169
-
170
-
171
-
172
-
173
-
174
-
175
-
176
-
177
-
178
-
179
-
180
-
181
-
182
-
183
-
184
-
185
-
186
-
187
-
188
-
189
-
190
-
191
-
192
-
193
-
194
-
195
-
196
-
197
-
198
-
199
-
200
-
201
-
202
-
203
-
204
-
205
-
206
-
207
-
208
-
209
-
210
-
211
-
212
-
213
-
214
-
215
-
216
 |
 |

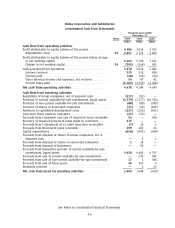
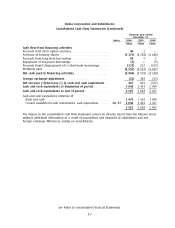
Nokia Corporation and Subsidiaries
Consolidated Cash Flow Statements (Continued)
Financial year ended
December 31
Notes 2006 2005 2004
EURm EURm EURm
Cash flow from financing activities
Proceeds from stock option exercises ************************* 46 2—
Purchase of treasury shares********************************** (3 371) (4 258) (2 648)
Proceeds from longterm borrowings ************************* 56 51
Repayment of longterm borrowings ************************* (7) — (3)
Proceeds from (+)/repayment of () shortterm borrowings ****** (137) 212 (255)
Dividends paid ********************************************* (1 553) (1 531) (1 413)
Net cash used in financing activities *********************** (4 966) (5 570) (4 318)
Foreign exchange adjustment****************************** (51) 183 (23)
Net increase (+)/decrease () in cash and cash equivalents ** 467 601 (327)
Cash and cash equivalents at beginning of period ********** 3 058 2 457 2 784
Cash and cash equivalents at end of period **************** 3 525 3 058 2 457
Cash and cash equivalents comprise of:
Bank and cash ******************************************* 1 479 1 565 1 090
Current availableforsale investments, cash equivalents******* 16, 37 2 046 1 493 1 367
3 525 3 058 2 457
The figures in the consolidated cash flow statement cannot be directly traced from the balance sheet
without additional information as a result of acquisitions and disposals of subsidiaries and net
foreign exchange differences arising on consolidation.
See Notes to Consolidated Financial Statements.
F7