Nokia 2006 Annual Report Download - page 72
Download and view the complete annual report
Please find page 72 of the 2006 Nokia annual report below. You can navigate through the pages in the report by either clicking on the pages listed below, or by using the keyword search tool below to find specific information within the annual report.-
 1
1 -
2
-
3
-
4
-
5
-
6
-
7
-
8
-
9
-
10
-
11
-
12
-
13
-
14
-
15
-
16
-
17
-
18
-
19
-
20
-
21
-
22
-
23
-
24
-
25
-
26
-
27
-
28
-
29
-
30
-
31
-
32
-
33
-
34
-
35
-
36
-
37
-
38
-
39
-
40
-
41
-
42
-
43
-
44
-
45
-
46
-
47
-
48
-
49
-
50
-
51
-
52
-
53
-
54
-
55
-
56
-
57
-
58
-
59
-
60
-
61
-
 62
62 -
 63
63 -
 64
64 -
 65
65 -
 66
66 -
 67
67 -
 68
68 -
 69
69 -
 70
70 -
 71
71 -
 72
72 -
 73
73 -
 74
74 -
 75
75 -
 76
76 -
 77
77 -
 78
78 -
 79
79 -
 80
80 -
 81
81 -
 82
82 -
83
-
84
-
85
-
86
-
87
-
88
-
89
-
90
-
91
-
92
-
93
-
94
-
95
-
96
-
97
-
98
-
99
-
100
-
101
-
102
-
103
-
104
-
105
-
106
-
107
-
108
-
109
-
110
-
111
-
112
-
113
-
114
-
115
-
116
-
117
-
118
-
119
-
120
-
121
-
122
-
123
-
124
-
125
-
126
-
127
-
128
-
129
-
130
-
131
-
132
-
133
-
134
-
135
-
136
-
137
-
138
-
139
-
140
-
141
-
142
-
143
-
144
-
145
-
146
-
147
-
148
-
149
-
150
-
151
-
152
-
153
-
154
-
155
-
156
-
157
-
158
-
159
-
160
-
161
-
162
-
163
-
164
-
165
-
166
-
167
-
168
-
169
-
170
-
171
-
172
-
173
-
174
-
175
-
176
-
177
-
178
-
179
-
180
-
181
-
182
-
183
-
184
-
185
-
186
-
187
-
188
-
189
-
190
-
191
-
192
-
193
-
194
-
195
-
196
-
197
-
198
-
199
-
200
-
201
-
202
-
203
-
204
-
205
-
206
-
207
-
208
-
209
-
210
-
211
-
212
-
213
-
214
-
215
-
216
 |
 |
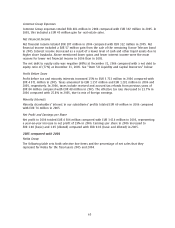
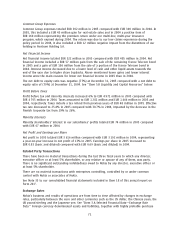
Common Group Expenses
Common Group expenses totaled EUR 392 million in 2005 compared with EUR 309 million in 2004. In
2005, this included a EUR 45 million gain for real estate sales and in 2004 a positive item of
EUR 160 million representing the premium return under our multiline, multiyear insurance
program, which expired during 2004. The return was due to our low claims experience during the
policy period. In 2004, it also included a EUR 12 million negative impact from the divestiture of our
holding in Nextrom Holding S.A.
Net Financial Income
Net financial income totaled EUR 322 million in 2005 compared with EUR 405 million in 2004. Net
financial income included a EUR 57 million gain from the sale of the remaining France Telecom bond
in 2005 and a gain of EUR 106 million from the sale of a portion of the France Telecom bond in
2004. Interest income decreased due to a lower level of cash and other liquid assets towards the
end of the year due to higher share buybacks. Above mentioned lower gains and lower interest
income were the main reasons for lower net financial income in 2005 than in 2004.
The net debt to equity ratio was negative (77%) at December 31, 2005 compared with a net debt to
equity ratio of (79%) at December 31, 2004. See ‘‘Item 5.B Liquidity and Capital Resources’’ below.
Profit Before Taxes
Profit before tax and minority interests increased 6% to EUR 4 971 million in 2005 compared with
EUR 4 705 million in 2004. Taxes amounted to EUR 1 281 million and EUR 1 446 million in 2005 and
2004, respectively. Taxes include a tax refund from previous years of EUR 48 million in 2005. Effective
tax rate decreased to 25.8% in 2005 compared with 30.7% in 2004, impacted by the decrease in the
Finnish Corporate tax from 29% to 26%.
Minority Interests
Minority shareholders’ interest in our subsidiaries’ profits totaled EUR 74 million in 2005 compared
with EUR 67 million in 2004.
Net Profit and Earnings per Share
Net profit in 2005 totaled EUR 3 616 million compared with EUR 3 192 million in 2004, representing
a yearonyear increase in net profit of 13% in 2005. Earnings per share in 2005 increased to
EUR 0.83 (basic and diluted) compared with EUR 0.69 (basic and diluted) in 2004.
Related Party Transactions
There have been no material transactions during the last three fiscal years to which any director,
executive officer or at least 5% shareholder, or any relative or spouse of any of them, was party.
There is no significant outstanding indebtedness owed to Nokia by any director, executive officer or
at least 5% shareholder.
There are no material transactions with enterprises controlling, controlled by or under common
control with Nokia or associates of Nokia.
See Note 33 to our consolidated financial statements included in Item 18 of this annual report on
Form 20F.
Exchange Rates
Nokia’s business and results of operations are from time to time affected by changes in exchange
rates, particularly between the euro and other currencies such as the US dollar, the Chinese yuan, the
UK pound sterling and the Japanese yen. See ‘‘Item 3.A Selected Financial Data—Exchange Rate
Data.’’ Foreign currency denominated assets and liabilities, together with highly probable purchase
71