Nokia 2006 Annual Report Download - page 141
Download and view the complete annual report
Please find page 141 of the 2006 Nokia annual report below. You can navigate through the pages in the report by either clicking on the pages listed below, or by using the keyword search tool below to find specific information within the annual report.-
 1
1 -
2
-
3
-
4
-
5
-
6
-
7
-
8
-
9
-
10
-
11
-
12
-
13
-
14
-
15
-
16
-
17
-
18
-
19
-
20
-
21
-
22
-
23
-
24
-
25
-
26
-
27
-
28
-
29
-
30
-
31
-
32
-
33
-
34
-
35
-
36
-
37
-
38
-
39
-
40
-
41
-
42
-
43
-
44
-
45
-
46
-
47
-
48
-
49
-
50
-
51
-
52
-
53
-
54
-
55
-
56
-
57
-
58
-
59
-
60
-
61
-
62
-
63
-
64
-
65
-
66
-
67
-
68
-
69
-
70
-
71
-
72
-
73
-
74
-
75
-
76
-
77
-
78
-
79
-
80
-
81
-
82
-
83
-
84
-
85
-
86
-
87
-
88
-
89
-
90
-
91
-
92
-
93
-
94
-
95
-
96
-
97
-
98
-
99
-
100
-
101
-
102
-
103
-
104
-
105
-
106
-
107
-
108
-
109
-
110
-
111
-
112
-
113
-
114
-
115
-
116
-
117
-
118
-
119
-
120
-
121
-
122
-
123
-
124
-
125
-
126
-
127
-
128
-
129
-
130
-
 131
131 -
 132
132 -
 133
133 -
 134
134 -
 135
135 -
 136
136 -
 137
137 -
 138
138 -
 139
139 -
 140
140 -
 141
141 -
 142
142 -
 143
143 -
 144
144 -
 145
145 -
 146
146 -
 147
147 -
 148
148 -
 149
149 -
 150
150 -
 151
151 -
152
-
153
-
154
-
155
-
156
-
157
-
158
-
159
-
160
-
161
-
162
-
163
-
164
-
165
-
166
-
167
-
168
-
169
-
170
-
171
-
172
-
173
-
174
-
175
-
176
-
177
-
178
-
179
-
180
-
181
-
182
-
183
-
184
-
185
-
186
-
187
-
188
-
189
-
190
-
191
-
192
-
193
-
194
-
195
-
196
-
197
-
198
-
199
-
200
-
201
-
202
-
203
-
204
-
205
-
206
-
207
-
208
-
209
-
210
-
211
-
212
-
213
-
214
-
215
-
216
 |
 |

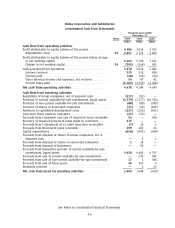
Nokia Corporation and Subsidiaries
Consolidated Cash Flow Statements
Financial year ended
December 31
Notes 2006 2005 2004
EURm EURm EURm
Cash flow from operating activities
Profit attributable to equity holders of the parent ************** 4 306 3 616 3 192
Adjustments, total **************************************** 34 1 857 1 774 2 059
Profit attributable to equity holders of the parent before change
in net working capital ************************************* 6 163 5 390 5 251
Change in net working capital****************************** 34 (793) (366) 241
Cash generated from operations ****************************** 5 370 5 024 5 492
Interest received ****************************************** 235 353 204
Interest paid ********************************************* (18) (26) (26)
Other financial income and expenses, net received************ 54 47 41
Income taxes paid **************************************** (1 163) (1 254) (1 368)
Net cash from operating activities ************************** 4 478 4 144 4 343
Cash flow from investing activities
Acquisition of Group companies, net of acquired cash *********** (517) (92) —
Purchase of current availableforsale investments, liquid assets ** (3 219) (7 277) (10 318)
Purchase of noncurrent availableforsale investments ********** (88) (89) (388)
Purchase of shares in associated companies******************** (15) (16) (109)
Additions to capitalized development costs ******************** (127) (153) (101)
Longterm loans made to customers ************************** (11) (56) —
Proceeds from repayment and sale of longterm loans receivable 56 — 368
Recovery of impaired longterm loans made to customers ******* 276 ——
Proceeds from (+)/payment of () other longterm receivables **** (3) 14 2
Proceeds from shortterm loans receivable ********************* 199 182 66
Capital expenditures***************************************** (650) (607) (548)
Proceeds from disposal of shares in Group companies, net of
disposed cash ******************************************** —51
Proceeds from disposal of shares in associated companies ******* 118 —
Proceeds from disposal of businesses ************************* —95 —
Proceeds from maturities and sale of current availableforsale
investments, liquid assets********************************** 5 058 9 402 9 737
Proceeds from sale of current availableforsale investments ***** —247 587
Proceeds from sale of noncurrent availableforsale investments 17 3 346
Proceeds from sale of fixed assets **************************** 29 167 6
Dividends received ****************************************** —122
Net cash from (used in) investing activities ***************** 1 006 1 844 (329)
See Notes to Consolidated Financial Statements.
F6