Nokia 2006 Annual Report Download - page 194
Download and view the complete annual report
Please find page 194 of the 2006 Nokia annual report below. You can navigate through the pages in the report by either clicking on the pages listed below, or by using the keyword search tool below to find specific information within the annual report.-
 1
1 -
2
-
3
-
4
-
5
-
6
-
7
-
8
-
9
-
10
-
11
-
12
-
13
-
14
-
15
-
16
-
17
-
18
-
19
-
20
-
21
-
22
-
23
-
24
-
25
-
26
-
27
-
28
-
29
-
30
-
31
-
32
-
33
-
34
-
35
-
36
-
37
-
38
-
39
-
40
-
41
-
42
-
43
-
44
-
45
-
46
-
47
-
48
-
49
-
50
-
51
-
52
-
53
-
54
-
55
-
56
-
57
-
58
-
59
-
60
-
61
-
62
-
63
-
64
-
65
-
66
-
67
-
68
-
69
-
70
-
71
-
72
-
73
-
74
-
75
-
76
-
77
-
78
-
79
-
80
-
81
-
82
-
83
-
84
-
85
-
86
-
87
-
88
-
89
-
90
-
91
-
92
-
93
-
94
-
95
-
96
-
97
-
98
-
99
-
100
-
101
-
102
-
103
-
104
-
105
-
106
-
107
-
108
-
109
-
110
-
111
-
112
-
113
-
114
-
115
-
116
-
117
-
118
-
119
-
120
-
121
-
122
-
123
-
124
-
125
-
126
-
127
-
128
-
129
-
130
-
131
-
132
-
133
-
134
-
135
-
136
-
137
-
138
-
139
-
140
-
141
-
142
-
143
-
144
-
145
-
146
-
147
-
148
-
149
-
150
-
151
-
152
-
153
-
154
-
155
-
156
-
157
-
158
-
159
-
160
-
161
-
162
-
163
-
164
-
165
-
166
-
167
-
168
-
169
-
170
-
171
-
172
-
173
-
174
-
175
-
176
-
177
-
178
-
179
-
180
-
181
-
182
-
183
-
 184
184 -
 185
185 -
 186
186 -
 187
187 -
 188
188 -
 189
189 -
 190
190 -
 191
191 -
 192
192 -
 193
193 -
 194
194 -
 195
195 -
 196
196 -
 197
197 -
 198
198 -
 199
199 -
 200
200 -
 201
201 -
 202
202 -
 203
203 -
 204
204 -
205
-
206
-
207
-
208
-
209
-
210
-
211
-
212
-
213
-
214
-
215
-
216
 |
 |
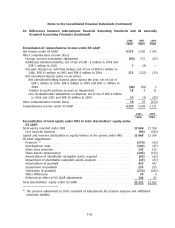
Notes to the Consolidated Financial Statements (Continued)
37. Risk management (Continued)
Nokia uses the ValueatRisk (‘‘VaR’’) methodology to assess the foreign exchange risk related to the
Treasury management of the Group exposures. The VaR figure represents the potential fair value
losses for a portfolio resulting from adverse changes in market factors using a specified time period
and confidence level based on historical data. To correctly take into account the nonlinear price
function of certain derivative instruments, Nokia uses Monte Carlo simulation. Volatilities and
correlations are calculated from a oneyear set of daily data.
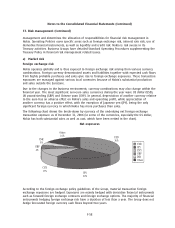
Since Nokia has subsidiaries outside the Eurozone, the eurodenominated value of the shareholders’
equity of Nokia is also exposed to fluctuations in exchange rates. Equity changes caused by
movements in foreign exchange rates are shown as a translation difference in the Group
consolidation. Nokia uses, from time to time, foreign exchange contracts and foreign currency
denominated loans to hedge its equity exposure arising from foreign net investments.
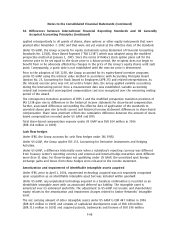
Interest rate risk
The Group is exposed to interest rate risk either through market value fluctuations of balance sheet
items (i.e. price risk) or through changes in interest income or expenses (i.e. reinvestment risk).
Interest rate risk mainly arises through interestbearing liabilities and assets. Estimated future
changes in cash flows and balance sheet structure also expose the Group to interest rate risk.
Treasury is responsible for monitoring and managing the interest rate exposure of the Group. Due to
the current balance sheet structure of Nokia, emphasis is placed on managing the interest rate risk
of investments.
Nokia uses the VaR methodology to assess and measure the interest rate risk in the investment
portfolio, which is benchmarked against a combination of threemonth and onetothreeyear
investment horizon. The VaR figure represents the potential fair value losses for a portfolio resulting
from adverse changes in market factors using a specified time period and confidence level based on
historical data. For interest rate risk VaR, Nokia uses variancecovariance methodology. Volatilities
and correlations are calculated from a oneyear set of daily data.
Equity price risk
Nokia has certain strategic minority investments in publicly traded companies. These investments are
classified as availableforsale. The fair value of the equity investments at December 31, 2006 was
EUR 8 million (EUR 8 million in 2005).
There are currently no outstanding derivative financial instruments designated as hedges of these
equity investments.
In addition to the listed equity holdings, Nokia invests in private equity through Nokia Venture
Funds. The fair value of these availableforsale equity investments at December 31, 2006 was
USD 220 million (USD 177 million in 2005).
Nokia is exposed to equity price risk on social security costs relating to stock compensation plans.
Nokia hedges this risk by entering into cash settled equity swap and option contracts.
b) Credit risk
Structured Finance Credit Risk
Network operators in some markets sometimes require their suppliers to arrange or provide term
financing in relation to infrastructure projects. Nokia has maintained a financing policy aimed at
close cooperation with banks, financial institutions and Export Credit Agencies to support selected
F59