Nokia 2006 Annual Report Download - page 66
Download and view the complete annual report
Please find page 66 of the 2006 Nokia annual report below. You can navigate through the pages in the report by either clicking on the pages listed below, or by using the keyword search tool below to find specific information within the annual report.-
 1
1 -
2
-
3
-
4
-
5
-
6
-
7
-
8
-
9
-
10
-
11
-
12
-
13
-
14
-
15
-
16
-
17
-
18
-
19
-
20
-
21
-
22
-
23
-
24
-
25
-
26
-
27
-
28
-
29
-
30
-
31
-
32
-
33
-
34
-
35
-
36
-
37
-
38
-
39
-
40
-
41
-
42
-
43
-
44
-
45
-
46
-
47
-
48
-
49
-
50
-
51
-
52
-
53
-
54
-
55
-
 56
56 -
 57
57 -
 58
58 -
 59
59 -
 60
60 -
 61
61 -
 62
62 -
 63
63 -
 64
64 -
 65
65 -
 66
66 -
 67
67 -
 68
68 -
 69
69 -
 70
70 -
 71
71 -
 72
72 -
 73
73 -
 74
74 -
 75
75 -
 76
76 -
77
-
78
-
79
-
80
-
81
-
82
-
83
-
84
-
85
-
86
-
87
-
88
-
89
-
90
-
91
-
92
-
93
-
94
-
95
-
96
-
97
-
98
-
99
-
100
-
101
-
102
-
103
-
104
-
105
-
106
-
107
-
108
-
109
-
110
-
111
-
112
-
113
-
114
-
115
-
116
-
117
-
118
-
119
-
120
-
121
-
122
-
123
-
124
-
125
-
126
-
127
-
128
-
129
-
130
-
131
-
132
-
133
-
134
-
135
-
136
-
137
-
138
-
139
-
140
-
141
-
142
-
143
-
144
-
145
-
146
-
147
-
148
-
149
-
150
-
151
-
152
-
153
-
154
-
155
-
156
-
157
-
158
-
159
-
160
-
161
-
162
-
163
-
164
-
165
-
166
-
167
-
168
-
169
-
170
-
171
-
172
-
173
-
174
-
175
-
176
-
177
-
178
-
179
-
180
-
181
-
182
-
183
-
184
-
185
-
186
-
187
-
188
-
189
-
190
-
191
-
192
-
193
-
194
-
195
-
196
-
197
-
198
-
199
-
200
-
201
-
202
-
203
-
204
-
205
-
206
-
207
-
208
-
209
-
210
-
211
-
212
-
213
-
214
-
215
-
216
 |
 |
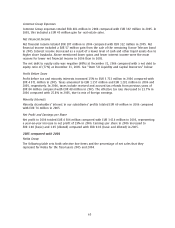
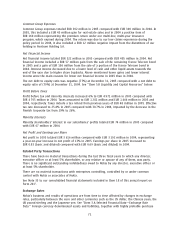
Common Group Expenses
Common Group expenses totaled EUR 481 million in 2006 compared with EUR 392 million in 2005. In
2005, this included a EUR 45 million gain for real estate sales.
Net Financial Income
Net financial income totaled EUR 207 million in 2006 compared with EUR 322 million in 2005. Net
financial income included a EUR 57 million gain from the sale of the remaining France Telecom bond
in 2005. Interest income decreased as a result of a lower level of cash and other liquid assets due to
higher share buybacks. Above mentioned lower gains and lower interest income were the main
reasons for lower net financial income in 2006 than in 2005.
The net debt to equity ratio was negative (68%) at December 31, 2006 compared with a net debt to
equity ratio of (77%) at December 31, 2005. See ‘‘Item 5.B Liquidity and Capital Resources’’ below.
Profit Before Taxes
Profit before tax and minority interests increased 15% to EUR 5 723 million in 2006 compared with
EUR 4 971 million in 2005. Taxes amounted to EUR 1 357 million and EUR 1 281 million in 2006 and
2005, respectively. In 2006, taxes include received and accrued tax refunds from previous years of
EUR 84 million compared with EUR 48 million in 2005. The effective tax rate decreased to 23.7% in
2006 compared with 25.8% in 2005, due to mix of foreign earnings.
Minority Interests
Minority shareholders’ interest in our subsidiaries’ profits totaled EUR 60 million in 2006 compared
with EUR 74 million in 2005.
Net Profit and Earnings per Share
Net profit in 2006 totaled EUR 4 306 million compared with EUR 3 616 million in 2005, representing
a yearonyear increase in net profit of 19% in 2006. Earnings per share in 2006 increased to
EUR 1.06 (basic) and 1.05 (diluted) compared with EUR 0.83 (basic and diluted) in 2005.
2005 compared with 2004
Nokia Group
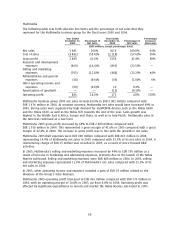
The following table sets forth selective line items and the percentage of net sales that they
represent for Nokia for the fiscal years 2005 and 2004.
65