Nokia 2006 Annual Report Download - page 209
Download and view the complete annual report
Please find page 209 of the 2006 Nokia annual report below. You can navigate through the pages in the report by either clicking on the pages listed below, or by using the keyword search tool below to find specific information within the annual report.-
 1
1 -
2
-
3
-
4
-
5
-
6
-
7
-
8
-
9
-
10
-
11
-
12
-
13
-
14
-
15
-
16
-
17
-
18
-
19
-
20
-
21
-
22
-
23
-
24
-
25
-
26
-
27
-
28
-
29
-
30
-
31
-
32
-
33
-
34
-
35
-
36
-
37
-
38
-
39
-
40
-
41
-
42
-
43
-
44
-
45
-
46
-
47
-
48
-
49
-
50
-
51
-
52
-
53
-
54
-
55
-
56
-
57
-
58
-
59
-
60
-
61
-
62
-
63
-
64
-
65
-
66
-
67
-
68
-
69
-
70
-
71
-
72
-
73
-
74
-
75
-
76
-
77
-
78
-
79
-
80
-
81
-
82
-
83
-
84
-
85
-
86
-
87
-
88
-
89
-
90
-
91
-
92
-
93
-
94
-
95
-
96
-
97
-
98
-
99
-
100
-
101
-
102
-
103
-
104
-
105
-
106
-
107
-
108
-
109
-
110
-
111
-
112
-
113
-
114
-
115
-
116
-
117
-
118
-
119
-
120
-
121
-
122
-
123
-
124
-
125
-
126
-
127
-
128
-
129
-
130
-
131
-
132
-
133
-
134
-
135
-
136
-
137
-
138
-
139
-
140
-
141
-
142
-
143
-
144
-
145
-
146
-
147
-
148
-
149
-
150
-
151
-
152
-
153
-
154
-
155
-
156
-
157
-
158
-
159
-
160
-
161
-
162
-
163
-
164
-
165
-
166
-
167
-
168
-
169
-
170
-
171
-
172
-
173
-
174
-
175
-
176
-
177
-
178
-
179
-
180
-
181
-
182
-
183
-
184
-
185
-
186
-
187
-
188
-
189
-
190
-
191
-
192
-
193
-
194
-
195
-
196
-
197
-
198
-
 199
199 -
 200
200 -
 201
201 -
 202
202 -
 203
203 -
 204
204 -
 205
205 -
 206
206 -
 207
207 -
 208
208 -
 209
209 -
 210
210 -
 211
211 -
 212
212 -
 213
213 -
 214
214 -
 215
215 -
 216
216
 |
 |

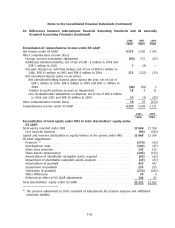
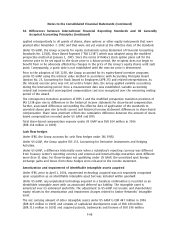
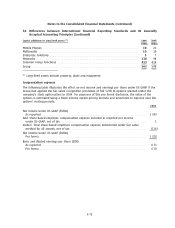
Notes to the Consolidated Financial Statements (Continued)
38. Differences between International Financial Reporting Standards and US Generally
Accepted Accounting Principles (Continued)
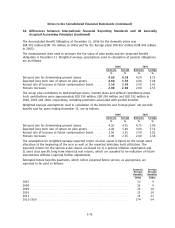
Pension expense
For its singleemployer defined benefit pension schemes, net periodic pension cost included in the
Group’s US GAAP net income for the years ended December 31, 2006, 2005 and 2004, includes the
following components:
2006 2005 2004
EURm EURm EURm
Service cost — benefits earned during the year(1) ************************** 101 69 62
Interest on projected benefit obligation ********************************** 66 58 56
Expected return on assets *********************************************** (62) (64) (56)
Amortization of prior service cost **************************************** 532
Recognized net actuarial (gain) loss ************************************** 45 (5)
Amortization of transition asset****************************************** 111
Transfer from central pool *********************************************** —(24) —
Curtailment************************************************************ (5) ——
Net periodic pension cost *********************************************** 110 48 60
(1) Excludes premiums associated with pooled benefits.
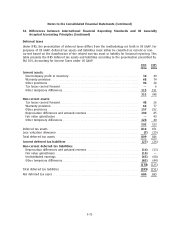
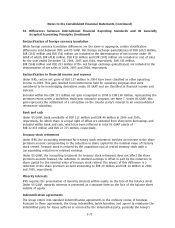
The following table sets forth the changes in the benefit obligation and fair value of plan assets
during the year and the funded status of the significant defined benefit pension plans showing the
amounts that are recognized in the Group’s consolidated balance sheet in accordance with US GAAP
at December 31:
2006 2005
Domestic Foreign Domestic Foreign
plans plans plans plans
EURm EURm
Projected benefit obligation at beginning of year*********** (890) (495) (727) (398)
Foreign currency exchange rate changes******************* — (3) — (3)
Service cost ******************************************** (63) (38) (48) (21)
Interest on projected benefit obligation ******************* (40) (26) (36) (22)
Plan participants’ contributions ************************** — (7) — (6)
Actuarial gain (loss)************************************* (51) 14 (91) (52)
Curtailment ******************************************** 2— 3—
Benefits paid******************************************* 11 9 97
Projected benefit obligation at end of year **************** (1 031) (546) (890) (495)
Plan assets at fair value at beginning of year ************** 904 373 768 303
Foreign currency exchange rate changes******************* —3—4
Actual return on plan assets ***************************** 33 18 102 40
Employer contribution*********************************** 59 32 19 27
Plan participants’ contributions ************************** —7—6
Transfer from central pool ******************************* —— 24 —
Benefits paid******************************************* (11) (9) (9) (7)
Plan assets at fair value at end of year******************** 985 424 904 373
F74