Nokia 2006 Annual Report Download - page 10
Download and view the complete annual report
Please find page 10 of the 2006 Nokia annual report below. You can navigate through the pages in the report by either clicking on the pages listed below, or by using the keyword search tool below to find specific information within the annual report.-
 1
1 -
 2
2 -
 3
3 -
 4
4 -
 5
5 -
 6
6 -
 7
7 -
 8
8 -
 9
9 -
 10
10 -
 11
11 -
 12
12 -
 13
13 -
 14
14 -
 15
15 -
 16
16 -
 17
17 -
 18
18 -
 19
19 -
 20
20 -
 21
21 -
22
-
23
-
24
-
25
-
26
-
27
-
28
-
29
-
30
-
31
-
32
-
33
-
34
-
35
-
36
-
37
-
38
-
39
-
40
-
41
-
42
-
43
-
44
-
45
-
46
-
47
-
48
-
49
-
50
-
51
-
52
-
53
-
54
-
55
-
56
-
57
-
58
-
59
-
60
-
61
-
62
-
63
-
64
-
65
-
66
-
67
-
68
-
69
-
70
-
71
-
72
-
73
-
74
-
75
-
76
-
77
-
78
-
79
-
80
-
81
-
82
-
83
-
84
-
85
-
86
-
87
-
88
-
89
-
90
-
91
-
92
-
93
-
94
-
95
-
96
-
97
-
98
-
99
-
100
-
101
-
102
-
103
-
104
-
105
-
106
-
107
-
108
-
109
-
110
-
111
-
112
-
113
-
114
-
115
-
116
-
117
-
118
-
119
-
120
-
121
-
122
-
123
-
124
-
125
-
126
-
127
-
128
-
129
-
130
-
131
-
132
-
133
-
134
-
135
-
136
-
137
-
138
-
139
-
140
-
141
-
142
-
143
-
144
-
145
-
146
-
147
-
148
-
149
-
150
-
151
-
152
-
153
-
154
-
155
-
156
-
157
-
158
-
159
-
160
-
161
-
162
-
163
-
164
-
165
-
166
-
167
-
168
-
169
-
170
-
171
-
172
-
173
-
174
-
175
-
176
-
177
-
178
-
179
-
180
-
181
-
182
-
183
-
184
-
185
-
186
-
187
-
188
-
189
-
190
-
191
-
192
-
193
-
194
-
195
-
196
-
197
-
198
-
199
-
200
-
201
-
202
-
203
-
204
-
205
-
206
-
207
-
208
-
209
-
210
-
211
-
212
-
213
-
214
-
215
-
216
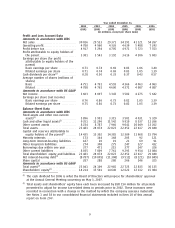
 |
 |

Year ended December 31,
2002 2003 2004 2005 2006 2006
(EUR) (EUR) (EUR) (EUR) (EUR) (USD)
(in millions, except per share data)
Profit and Loss Account Data
Amounts in accordance with IFRS
Net sales **************************** 30 016 29 533 29 371 34 191 41 121 54 267
Operating profit********************** 4 780 4 960 4 326 4 639 5 488 7 243
Profit before tax ********************* 4 917 5 294 4 705 4 971 5 723 7 553
Profit attributable to equity holders of
the parent************************* 3 381 3 543 3 192 3 616 4 306 5 683
Earnings per share (for profit
attributable to equity holders of the
parent)
Basic earnings per share ************ 0.71 0.74 0.69 0.83 1.06 1.40
Diluted earnings per share ********** 0.71 0.74 0.69 0.83 1.05 1.39
Cash dividends per share(1) ************ 0.28 0.30 0.33 0.37 0.43 0.57
Average number of shares (millions of
shares)
Basic ***************************** 4 751 4 761 4 593 4 366 4 063 4 063
Diluted**************************** 4 788 4 761 4 600 4 371 4 087 4 087
Amounts in accordance with US GAAP
Net income************************** 3 603 4 097 3 343 3 582 4 275 5 642
Earnings per share (net income)
Basic earnings per share ************ 0.76 0.86 0.73 0.82 1.05 1.39
Diluted earnings per share ********** 0.75 0.86 0.73 0.82 1.05 1.39
Balance Sheet Data
Amounts in accordance with IFRS
Fixed assets and other noncurrent
assets(2) *************************** 5 896 3 991 3 315 3 501 4 031 5 320
Cash and other liquid assets(3) ********* 9 351 11 296 11 542 9 910 8 537 11 266
Other current assets ****************** 8 234 8 787 7 966 9 041 10 049 13 262
Total assets************************** 23 481 24 074 22 823 22 452 22 617 29 848
Capital and reserves attributable to
equity holders of the parent(2) ******* 14 435 15 302 14 385 12 309 11 968 15 794
Minority interests ******************** 173 164 168 205 92 121
Longterm interestbearing liabilities *** 187 20 19 21 69 91
Other longterm liabilities ************* 274 308 275 247 327 432
Borrowings due within one year ******* 377 471 215 377 247 326
Other current liabilities *************** 8 035 7 809 7 761 9 293 9 914 13 084
Total shareholders’ equity and liabilities 23 481 24 074 22 823 22 452 22 617 29 848
Net interestbearing debt(4) ************ (8 787) (10 805) (11 308) (9 512) (8 221) (10 849)
Share capital ************************ 287 288 280 266 246 325
Amounts in accordance with US GAAP
Total assets(2) ************************ 23 041 24 109 22 985 22 725 22 835 30 135
Shareholders’ equity(2) **************** 14 214 15 501 14 640 12 622 12 112 15 984
(1) The cash dividend for 2006 is what the Board of Directors will propose for shareholders’ approval
at the Annual General Meeting convening on May 3, 2007.
(2) Total assets and shareholders’ equity have each been increased by EUR 154 million for all periods
presented to adjust for income taxrelated items in periods prior to 2002. These increases were
recorded in connection with a change in the method by which the company assesses materiality.
See Notes 1 and 38 to our consolidated financial statements included in Item 18 of this annual
report on Form 20F.
9