Nokia 2006 Annual Report Download - page 162
Download and view the complete annual report
Please find page 162 of the 2006 Nokia annual report below. You can navigate through the pages in the report by either clicking on the pages listed below, or by using the keyword search tool below to find specific information within the annual report.-
 1
1 -
2
-
3
-
4
-
5
-
6
-
7
-
8
-
9
-
10
-
11
-
12
-
13
-
14
-
15
-
16
-
17
-
18
-
19
-
20
-
21
-
22
-
23
-
24
-
25
-
26
-
27
-
28
-
29
-
30
-
31
-
32
-
33
-
34
-
35
-
36
-
37
-
38
-
39
-
40
-
41
-
42
-
43
-
44
-
45
-
46
-
47
-
48
-
49
-
50
-
51
-
52
-
53
-
54
-
55
-
56
-
57
-
58
-
59
-
60
-
61
-
62
-
63
-
64
-
65
-
66
-
67
-
68
-
69
-
70
-
71
-
72
-
73
-
74
-
75
-
76
-
77
-
78
-
79
-
80
-
81
-
82
-
83
-
84
-
85
-
86
-
87
-
88
-
89
-
90
-
91
-
92
-
93
-
94
-
95
-
96
-
97
-
98
-
99
-
100
-
101
-
102
-
103
-
104
-
105
-
106
-
107
-
108
-
109
-
110
-
111
-
112
-
113
-
114
-
115
-
116
-
117
-
118
-
119
-
120
-
121
-
122
-
123
-
124
-
125
-
126
-
127
-
128
-
129
-
130
-
131
-
132
-
133
-
134
-
135
-
136
-
137
-
138
-
139
-
140
-
141
-
142
-
143
-
144
-
145
-
146
-
147
-
148
-
149
-
150
-
151
-
 152
152 -
 153
153 -
 154
154 -
 155
155 -
 156
156 -
 157
157 -
 158
158 -
 159
159 -
 160
160 -
 161
161 -
 162
162 -
 163
163 -
 164
164 -
 165
165 -
 166
166 -
 167
167 -
 168
168 -
 169
169 -
 170
170 -
 171
171 -
 172
172 -
173
-
174
-
175
-
176
-
177
-
178
-
179
-
180
-
181
-
182
-
183
-
184
-
185
-
186
-
187
-
188
-
189
-
190
-
191
-
192
-
193
-
194
-
195
-
196
-
197
-
198
-
199
-
200
-
201
-
202
-
203
-
204
-
205
-
206
-
207
-
208
-
209
-
210
-
211
-
212
-
213
-
214
-
215
-
216
 |
 |

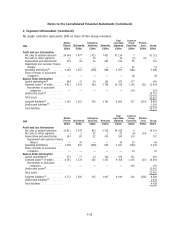
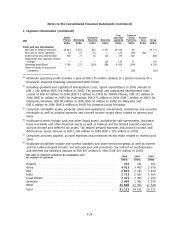
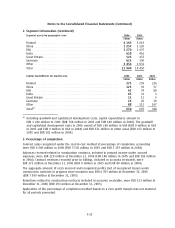
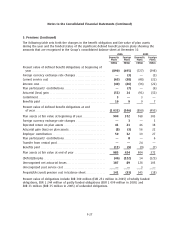
Notes to the Consolidated Financial Statements (Continued)
5. Pensions (Continued)
The following table sets forth the changes in the benefit obligation and fair value of plan assets
during the year and the funded status of the significant defined benefit pension plans showing the
amounts that are recognized in the Group’s consolidated balance sheet at December 31:
2006 2005
Domestic Foreign Domestic Foreign
Plans Plans Plans Plans
EURm EURm EURm EURm
Present value of defined benefit obligations at beginning of
year ************************************************** (890) (495) (727) (398)
Foreign currency exchange rate changes ******************** — (3) — (3)
Current service cost ************************************** (63) (38) (48) (21)
Interest cost ********************************************* (40) (26) (36) (22)
Plan participants’ contributions **************************** — (7) — (6)
Actuarial (loss) gain ************************************** (51) 14 (91) (52)
Curtailment********************************************** 3— 3—
Benefits paid ******************************************** 10 9 97
Present value of defined benefit obligations at end
of year************************************************ (1 031) (546) (890) (495)
Plan assets at fair value at beginning of year**************** 904 372 768 303
Foreign currency exchange rate changes ******************** —3—3
Expected return on plan assets **************************** 41 21 46 18
Actuarial gain (loss) on plan assets************************* (8) (3) 56 22
Employer contribution ************************************ 59 32 19 27
Plan participants’ contributions **************************** —8—6
Transfer from central pool********************************* —— 24 —
Benefits paid ******************************************** (11) (9) (9) (7)
Plan assets at fair value at end of year ********************* 985 424 904 372
(Deficit)/Surplus****************************************** (46) (122) 14 (123)
Unrecognized net actuarial losses ************************** 187 89 128 105
Unrecognized past service cost **************************** —— 3—
Prepaid/(Accrued) pension cost in balance sheet ************* 141 (33) 145 (18)
Present value of obligations include EUR 300 million (EUR 251 million in 2005) of wholly funded
obligations, EUR 1 244 million of partly funded obligations (EUR 1 099 million in 2005) and
EUR 33 million (EUR 35 million in 2005) of unfunded obligations.
F27