Nokia 2006 Annual Report Download - page 206
Download and view the complete annual report
Please find page 206 of the 2006 Nokia annual report below. You can navigate through the pages in the report by either clicking on the pages listed below, or by using the keyword search tool below to find specific information within the annual report.-
 1
1 -
2
-
3
-
4
-
5
-
6
-
7
-
8
-
9
-
10
-
11
-
12
-
13
-
14
-
15
-
16
-
17
-
18
-
19
-
20
-
21
-
22
-
23
-
24
-
25
-
26
-
27
-
28
-
29
-
30
-
31
-
32
-
33
-
34
-
35
-
36
-
37
-
38
-
39
-
40
-
41
-
42
-
43
-
44
-
45
-
46
-
47
-
48
-
49
-
50
-
51
-
52
-
53
-
54
-
55
-
56
-
57
-
58
-
59
-
60
-
61
-
62
-
63
-
64
-
65
-
66
-
67
-
68
-
69
-
70
-
71
-
72
-
73
-
74
-
75
-
76
-
77
-
78
-
79
-
80
-
81
-
82
-
83
-
84
-
85
-
86
-
87
-
88
-
89
-
90
-
91
-
92
-
93
-
94
-
95
-
96
-
97
-
98
-
99
-
100
-
101
-
102
-
103
-
104
-
105
-
106
-
107
-
108
-
109
-
110
-
111
-
112
-
113
-
114
-
115
-
116
-
117
-
118
-
119
-
120
-
121
-
122
-
123
-
124
-
125
-
126
-
127
-
128
-
129
-
130
-
131
-
132
-
133
-
134
-
135
-
136
-
137
-
138
-
139
-
140
-
141
-
142
-
143
-
144
-
145
-
146
-
147
-
148
-
149
-
150
-
151
-
152
-
153
-
154
-
155
-
156
-
157
-
158
-
159
-
160
-
161
-
162
-
163
-
164
-
165
-
166
-
167
-
168
-
169
-
170
-
171
-
172
-
173
-
174
-
175
-
176
-
177
-
178
-
179
-
180
-
181
-
182
-
183
-
184
-
185
-
186
-
187
-
188
-
189
-
190
-
191
-
192
-
193
-
194
-
195
-
 196
196 -
 197
197 -
 198
198 -
 199
199 -
 200
200 -
 201
201 -
 202
202 -
 203
203 -
 204
204 -
 205
205 -
 206
206 -
 207
207 -
 208
208 -
 209
209 -
 210
210 -
 211
211 -
 212
212 -
 213
213 -
 214
214 -
 215
215 -
 216
216
 |
 |

Notes to the Consolidated Financial Statements (Continued)
38. Differences between International Financial Reporting Standards and US Generally
Accepted Accounting Principles (Continued)
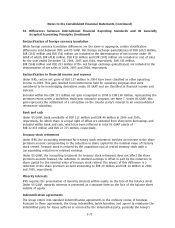
and manufactured by thirdparty suppliers include Nokiaspecific integrated circuits and radio
frequency components; servers; subassemblies such as printed wire board assemblies, filters,
combiners and power units; and cabinets. Moreover, a component supplier may fail to meet our
supplier requirements, such as, most notably, our and our customers’ product quality, safety, security
and other standards, and consequently some of our products may be unacceptable to us and our
customers, or may fail to meet our own quality controls. In addition, a particular component may be
available only from a limited number of suppliers. Suppliers may from time to time extend lead
times, limit supplies or increase prices due to capacity constraints or other factors, which could
adversely affect the Group’s ability to deliver products on a timely basis. Moreover, a component
supplier may experience delays or disruption to its manufacturing processes or financial difficulties.
Any of these events could delay our successful delivery of products and solutions that meet our and
our customers’ quality, safety, security and other requirements, or otherwise materially adversely
affect our sales and our results of operations.
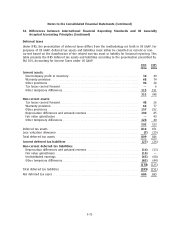
Segment information
The accounting policies of the segments are the same as those described in Note 1, Accounting
principles. Nokia accounts for intersegment revenues and transfers as if the revenues or transfers
were to third parties, and therefore at current market prices. Nokia evaluates the performance of its
segments and allocates resources to them based on operating profit.
Under IFRS, segment assets and liabilities of the horizontal groups are allocated to business groups
on a symmetrical basis. Under US GAAP, segment assets and liabilities are reported on the basis of
the internal reporting structure reflecting management reporting.
Assets on an IFRS basis as reported under FAS 131 as at December 31, 2006 for Mobile Phones,
Multimedia, Enterprise Solutions and Networks were EUR 2 947 million (EUR 2 525 million in 2005),
EUR 958 million (EUR 920 million in 2005), EUR 516 million (EUR 133 million in 2005) and
EUR 3 746 million (EUR 3 437 million in 2005), respectively. Liabilities on an IFRS basis as reported
under FAS 131 as at December 31, 2006 for Mobile Phones, Multimedia, Enterprise Solutions and
Networks were EUR 2 635 million (EUR 2 631 million in 2005), EUR 992 million (EUR 985 million in
2005), EUR 292 million (EUR 239 million in 2005) and EUR 1 703 million (EUR 1 607 million in 2005),
respectively. Assets and liabilities included in Common Group Functions as at December 31, 2006
were EUR 3 774 million (EUR 3 488 million in 2005) and EUR 3 577 million (EUR 2 987 million in
2005), respectively.
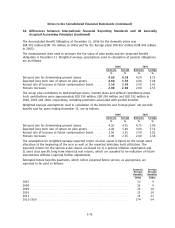
Long lived assets by location of assets (1): 2006 2005
EURm EURm
Finland********************************************************************** 755 745
China *********************************************************************** 219 174
USA************************************************************************* 117 126
India *********************************************************************** 77 31
Great Britain***************************************************************** 107 107
Germany ******************************************************************** 103 110
Other *********************************************************************** 224 292
Group*********************************************************************** 1 602 1 585
F71