Nokia 2006 Annual Report Download - page 49
Download and view the complete annual report
Please find page 49 of the 2006 Nokia annual report below. You can navigate through the pages in the report by either clicking on the pages listed below, or by using the keyword search tool below to find specific information within the annual report.-
 1
1 -
2
-
3
-
4
-
5
-
6
-
7
-
8
-
9
-
10
-
11
-
12
-
13
-
14
-
15
-
16
-
17
-
18
-
19
-
20
-
21
-
22
-
23
-
24
-
25
-
26
-
27
-
28
-
29
-
30
-
31
-
32
-
33
-
34
-
35
-
36
-
37
-
38
-
 39
39 -
 40
40 -
 41
41 -
 42
42 -
 43
43 -
 44
44 -
 45
45 -
 46
46 -
 47
47 -
 48
48 -
 49
49 -
 50
50 -
 51
51 -
 52
52 -
 53
53 -
 54
54 -
 55
55 -
 56
56 -
 57
57 -
 58
58 -
 59
59 -
60
-
61
-
62
-
63
-
64
-
65
-
66
-
67
-
68
-
69
-
70
-
71
-
72
-
73
-
74
-
75
-
76
-
77
-
78
-
79
-
80
-
81
-
82
-
83
-
84
-
85
-
86
-
87
-
88
-
89
-
90
-
91
-
92
-
93
-
94
-
95
-
96
-
97
-
98
-
99
-
100
-
101
-
102
-
103
-
104
-
105
-
106
-
107
-
108
-
109
-
110
-
111
-
112
-
113
-
114
-
115
-
116
-
117
-
118
-
119
-
120
-
121
-
122
-
123
-
124
-
125
-
126
-
127
-
128
-
129
-
130
-
131
-
132
-
133
-
134
-
135
-
136
-
137
-
138
-
139
-
140
-
141
-
142
-
143
-
144
-
145
-
146
-
147
-
148
-
149
-
150
-
151
-
152
-
153
-
154
-
155
-
156
-
157
-
158
-
159
-
160
-
161
-
162
-
163
-
164
-
165
-
166
-
167
-
168
-
169
-
170
-
171
-
172
-
173
-
174
-
175
-
176
-
177
-
178
-
179
-
180
-
181
-
182
-
183
-
184
-
185
-
186
-
187
-
188
-
189
-
190
-
191
-
192
-
193
-
194
-
195
-
196
-
197
-
198
-
199
-
200
-
201
-
202
-
203
-
204
-
205
-
206
-
207
-
208
-
209
-
210
-
211
-
212
-
213
-
214
-
215
-
216
 |
 |
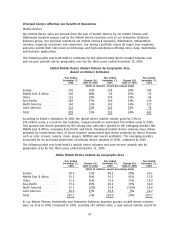
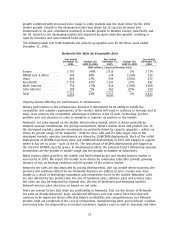
Nokia. Based on our market estimate, Nokia’s market share grew to 36% in 2006, compared to 33%
in 2005. In 2006, we estimated Nokia to be the market leader in Europe, AsiaPacific and Latin
America. Nokia was also the market leader in the fastest growing markets of the world, including
China, Middle East & Africa, South East AsiaPacific and India, as well as in WCDMA technology. In one
of the fastest growing segments of the market, converged devices (smartphones), Nokia’s estimated
share was approximately 50% in 2006.
Nokia believes that successfully competing in the mobile device industry is increasingly challenging,
as industry participants need to master many elements in order to win. The increasing industry
complexity and challenges of mastering the essential elements efficiently are driving a continuing
trend of consolidation. As a demonstration of this consolidation, the market share of the top five
competitors increased from less than 70% in 2000 to more than 85% by the end of 2006.
During 2006, Nokia gained device market share in China, AsiaPacific and Latin America. In China,
Nokia had another year of excellent market share gains driven by its extensive distribution system,
broad product portfolio, brand and a continued push into smaller cities and rural markets. Nokia’s
healthy market share gains in AsiaPacific were driven by gains in South East AsiaPacific, and we
also benefited from our strong position in the fastest growing markets like India. In AsiaPacific,
Nokia continued to benefit from its brand, broad product portfolio and extensive distribution system.
In Latin America, Nokia’s 2006 market share gains were driven by gains in markets like Brazil, Mexico
and Argentina. Nokia’s strength in Latin America was especially driven by its strong entrylevel
product portfolio and improving midrange offering.
In Europe, we estimated that our market share was down slightly in 2006. Nokia 2006 share gains in
markets like Italy, Russia, Spain and in WCDMA technology were offset by share declines in other
European markets, including the United Kingdom, as a result of the intense competitive environment.
In Middle East & Africa, our volume growth was below regional industry volume growth resulting in
a loss of market share, while the overall high growth of the area and Nokia’s strong market position
positively contributed to our global volume growth. Nokia continues to benefit in Middle East &
Africa from its brand, broad product portfolio and extensive distribution system.
In North America, conditions remained difficult. In 2006, the continued lack of broad acceptance of
certain products in our portfolio, and lower volumes in our CDMA business in the fourth quarter,
resulted in our volumes and market share declining compared to 2005.
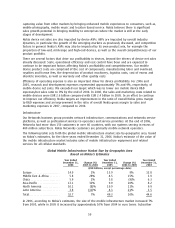
Nokia’s device ASP (average selling price) in 2006 was EUR 96, declining 7% from EUR 103 in 2005.
Nokia’s device ASP in 2004 was EUR 110. Industry ASPs declined in 2006, driven primarily by the
strong device volume growth in the emerging markets, which have lower ASPs. For Nokia, the ASP
decline was driven primarily by the growth of our market share in these emerging markets, in
addition to which certain highend products in our portfolio were not viewed as sufficiently
competitive in various markets.
Ongoing factors affecting our performance in mobile devices
Nokia’s performance in the mobile device business is determined by its ability to satisfy the
competitive and complex requirements of the market. Nokia will need to continue to leverage and in
some cases improve its competitive advantages of scale, brand, manufacturing and logistics,
technology, broad product portfolio, cost structure, quality and IPR. Nokia’s huge scale contributes to
its low cost structure. Brand is a major differentiating factor in the device industry, having broad
effects on market share and pricing. The device business is a consumer business and Nokia has the
sixth most valuable brand in the world (Interbrand 2006).
Nokia makes over 10 devices per second in its nine main device manufacturing facilities globally.
Nokia also enjoys a world class logistics and distribution system. In terms of technology, Nokia
believes it needs to develop, master, integrate and own relevant technology. This allows it to drive
down manufacturing costs and also benefit from technology evolutions and discontinuities in terms
of margin and market share.
48