Nokia 2006 Annual Report Download - page 51
Download and view the complete annual report
Please find page 51 of the 2006 Nokia annual report below. You can navigate through the pages in the report by either clicking on the pages listed below, or by using the keyword search tool below to find specific information within the annual report.-
 1
1 -
2
-
3
-
4
-
5
-
6
-
7
-
8
-
9
-
10
-
11
-
12
-
13
-
14
-
15
-
16
-
17
-
18
-
19
-
20
-
21
-
22
-
23
-
24
-
25
-
26
-
27
-
28
-
29
-
30
-
31
-
32
-
33
-
34
-
35
-
36
-
37
-
38
-
39
-
40
-
 41
41 -
 42
42 -
 43
43 -
 44
44 -
 45
45 -
 46
46 -
 47
47 -
 48
48 -
 49
49 -
 50
50 -
 51
51 -
 52
52 -
 53
53 -
 54
54 -
 55
55 -
 56
56 -
 57
57 -
 58
58 -
 59
59 -
 60
60 -
 61
61 -
62
-
63
-
64
-
65
-
66
-
67
-
68
-
69
-
70
-
71
-
72
-
73
-
74
-
75
-
76
-
77
-
78
-
79
-
80
-
81
-
82
-
83
-
84
-
85
-
86
-
87
-
88
-
89
-
90
-
91
-
92
-
93
-
94
-
95
-
96
-
97
-
98
-
99
-
100
-
101
-
102
-
103
-
104
-
105
-
106
-
107
-
108
-
109
-
110
-
111
-
112
-
113
-
114
-
115
-
116
-
117
-
118
-
119
-
120
-
121
-
122
-
123
-
124
-
125
-
126
-
127
-
128
-
129
-
130
-
131
-
132
-
133
-
134
-
135
-
136
-
137
-
138
-
139
-
140
-
141
-
142
-
143
-
144
-
145
-
146
-
147
-
148
-
149
-
150
-
151
-
152
-
153
-
154
-
155
-
156
-
157
-
158
-
159
-
160
-
161
-
162
-
163
-
164
-
165
-
166
-
167
-
168
-
169
-
170
-
171
-
172
-
173
-
174
-
175
-
176
-
177
-
178
-
179
-
180
-
181
-
182
-
183
-
184
-
185
-
186
-
187
-
188
-
189
-
190
-
191
-
192
-
193
-
194
-
195
-
196
-
197
-
198
-
199
-
200
-
201
-
202
-
203
-
204
-
205
-
206
-
207
-
208
-
209
-
210
-
211
-
212
-
213
-
214
-
215
-
216
 |
 |

capturing value from other markets by bringing enhanced mobile experiences to consumers, such as,
mobile photography, mobile music and location based service. Nokia believes there is significant
sales growth potential in bringing mobility to enterprises where the market is still at the early
stages of development.
Nokia device net sales are also impacted by device ASPs. ASPs are impacted by overall industry
dynamics, in particular the growth of the emerging markets as previously discussed, and competitive
factors in general. Nokia’s ASPs may also be impacted by its own product mix, for example the
proportion of lowend, midrange and highend devices, as well as the overall competitiveness of our
product portfolio.
There are several factors that drive our profitability in devices, beyond the drivers of device net sales
already discussed. Scale, operational efficiency and cost control have been and are expected to
continue to be important factors affecting Nokia’s profitability and competitiveness. Our mobile
device product costs are comprised of the cost of components, manufacturing labor and overhead,
royalties and license fees, the depreciation of product machinery, logistics costs, cost of excess and
obsolete inventory, as well as warranty and other quality costs.
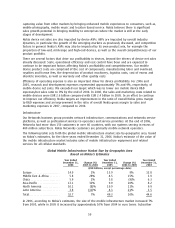
Efficiency of operating expense is also an important driver for device profitability. For 2006 and
2005, research and development expenses represented approximately 7% and 9%, respectively, of
mobile device net sales. We exceeded our target which was to lower our mobile device R&D
expenses/net sales ratio to 8% by the end of 2006. In 2006, the sales and marketing costs related to
mobile devices were EUR 2.6 billion compared with EUR 2.4 billion in 2005. In an effort to continue
to improve our efficiency, Nokia targets an improvement in the ratio of overall Nokia gross margin
to R&D expenses and an improvement in the ratio of overall Nokia gross margin to sales and
marketing expenses in 2007, compared to 2006.
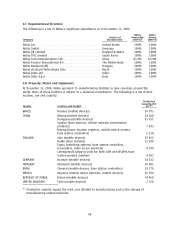
Infrastructure
Our Networks business group provides network infrastructure, communications and networks service
platforms, as well as professional services to operators and service providers. At the end of 2006,
Networks had more than 150 customers in over 60 countries, with our systems serving in excess of
400 million subscribers. Nokia Networks customers are primarily mobile network operators.
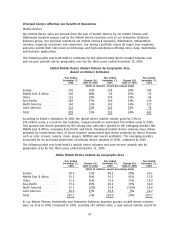
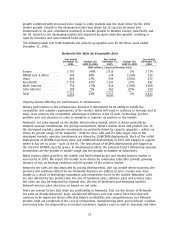
The following table sets forth the global mobile infrastructure market size by geographic area, based
on Nokia’s estimates, for the three years ended December 31, 2006. Nokia’s estimate of the value of
the mobile infrastructure market includes sales of mobile infrastructure equipment and related
services for all cellular standards.
Global Mobile Infrastructure Market Size by Geographic Area
Based on Nokia’s Estimates
Year Ended Year Ended Year Ended
December 31, Change (%) December 31, Change (%) December 31,
2006 2005 to 2006 2005 2004 to 2005 2004
(EUR billions, except percentage data)
Europe ******************* 14.0 1% 13.9 9% 12.8
Middle East & Africa ******* 5.8 28% 4.5 15% 3.9
China ******************** 5.9 1% 5.8 (9)% 6.3
AsiaPacific *************** 13.1 32% 9.9 20% 8.2
North America ************ 10.1 (8)% 10.9 11% 9.9
Latin America ************* 3.8 (11)% 4.3 21% 3.5
Total********************* 52.7 7% 49.3 10% 44.6
In 2006, according to Nokia’s estimates, the size of the mobile infrastructure market increased 7%
from 2005, while in 2005 it increased by approximately 10% from 2004 in euro terms. Subscriber
50